


- Modulus Modeling of PP/GF Composites by X-ray Micro-CT and Comparison with Experimental Data
Sung Sik Seo, Seok Min Lee*, Se Mi Kim**, Hee Jung Park***, and Kee Yoon Lee**,†

Analysis Support, R&D Center, Lotte Chemical Corp., 115 Gajeongbuk-ro, Yuseong-gu, Daejeon 34110, Korea
*PM Development team, R&D Center, Lotte Chemical Corp., 115 Gajeongbuk-ro, Yuseong-gu, Daejeon 34110, Korea
**Dept. of Polymer Science and Engineering, Chungnam National Univ., 99 Daehak-ro, Yuseong-gu, Daejeon 34134, Korea
***Western Seoul Center, Korea Basic Science Institute, 150 Bugahyeon-ro, Seodaemun-gu, Seoul 03759, Korea- X-선 마이크로-CT를 이용한 폴리프로필렌 유리섬유 복합체의 탄성계수 모델링과 실험 데이터와 비교
서성식 · 이석민* · 김세미** · 박희정*** · 이기윤**,†
롯데케미칼연구소 연구전략부문 분석지원담당, *롯데케미칼연구소 PM 개발팀 **충남대학교 고분자공학과, ***한국기초과학지원연구원, 서울서부센터
We investigated internal distributions of glass fibers (GFs) in injection molded dumbbell specimens of polypropylene (PP) composites by using the nondestructive analysis method. The mechanical properties of PP composites were mainly influenced by the fiber length distribution (FLD), aspect ratio (AR), and fiber orientation distribution (FOD), etc. The 2-D and 3-D images were generated by X-ray micro-CT to clearly analyze the fibers inside the injection mold formed according to the injection mold geometry and injection direction. We could confirm that the fibers were oriented toward the resin flow direction forming a fountain-like flow. The 3D images of the fibers were analyzed to obtain quantitative FLD and FOD data. The theoretical tensile modulus reflected by quantitative FLD, AR and FOD data turned out to be closer to experimental values than the theoretical tensile modulus values obtained only under unidirection. Therefore, the modulus values recalculated by adding tilt angles gave satisfactory result in accordance with the experimental data.
본 연구에서는 비파괴적 분석 방법인 X-선 마이크로-CT를 사용하여 폴리프로필렌(PP) 복합체로 사출 성형한 덤벨 시편 내부의 유리 섬유(GF) 분포들을 연구하였다. 폴리프로필렌 복합체의 기계적 물성은 섬유 길이 분포(FLD), 종횡비(AR) 그리고 섬유 배향 분포(FOD)에 영향을 받는다. 사출 몰드의 구조와 사출 방향에 따라 형성된 사출물 내부의 섬유들을 뚜렷하게 분석하기 위해 X-선 마이크로-CT로 2차원, 3차원적 이미지들을 얻었다. 우리는 섬유들이 분수 흐름을 형성하는 수지 흐름의 방향에 따라 기울어져 있다는 것을 확인하였다. 3차원 이미지 내의 섬유들에 대한 FLD, FOD 데이터를 정량화하였다. 정량화한 FLD, AR 그리고 FOD 데이터를 반영한 인장 탄성계수의 이론적 계산 값은 일방향으로 가정한 이론적 계산 값보다 실험치의 값과 유사하다는 것을 확인하였다. 따라서 기울어진 각도를 적용하여 인장 탄성계수를 다시 계산한 값이 실험치와 잘 부합함을 알 수 있었다.
Keywords: polypropylene/glass fiber composite, X-ray micro-CT, fiber length distribution, fiber orientation distribution, aspect ratio
Composites are designed and constructed to have the advantage of high strength and stiffness to lighten the product. In order to design efficient composite products, it is very important to predict the final properties from the physical properties of the polymer and filler, the amount of filler and its geometric shape. Therefore, theoretical studies have been conducted for decades based on experimental results.1-9 Eshelby has shown a mathematical approach using both the Mori-Tanaka’s average theory and Eshelby’s transformation tensor to interpret the properties of the composites.1-3
Halpin and Tsai provided useful results by simple formula for the properties of fiber-type fillers bonded to polymer matrix.4,5 The physical properties of the composites are largely influenced by the shape (aspect ratio) and content of the filler, the orientation, and the adhesion properties of the matrix and filler. Tandon and Weng analyzed the mechanical properties of the composite in 2-D, assuming that the fiber is oriented in unidirection by applying the geometric analysis and theory of elasticity.6,7 Lee et al. studied the mechanical properties of thermoplastic nanocomposites obtained by kneading MMT and nylon using a twin-screw extruder.8 In particular, the filler was expressed in the form of a 3-D ellipsoid with two aspect ratios, and the 3-D model was proposed to predict the modulus of the composite using the average theory and the Eshelby’s transformation tensor.9
These theoretical studies did not consider the effect of the fiber length distribution (FLD) and the fiber orientation distribution (FOD) on the properties of the fiber due to the breakage of the fiber and resin flow during the fabrication process.1-9 As a matter of fact, fiber breakage occurs during the injection process and affects the properties. The breakage is caused by the fiber-polymer interaction, the fiber-fiber interaction, and the contact of the fiber with the surface of the processing equipment.10-13 The various fiber breakages that occur during the processing of thermoplastic composites represent the FLD of the internal fibers of the composite and affect the mechanical properties such as strength and stiffness.14-16 In order to identify the FLD, composites must be burned or fiber residues should be analyzed by dissolving the matrix using a suitable solvent.13,14,17-20 However, these destructive methods could provide information only on the fiber length without other information such as the tilt angle. Therefore, many researchers have assumed that the fibers are oriented in unidirection within the injected composite. Also, information on the tilt angle of the fiber, an important factor in determining the mechanical properties of the composite, was obtained mainly from images obtained using SEM or microscope.14,16,21 However, in this information, only 2-D orientation information could be extracted without any 3-D orientation information.
Various methods have been tried, in terms of the 3-D orientation, to confirm the effect of FLD and FOD on the physical properties of the composites. Fu et al. had employed the modified rule of mixtures in order to calculate the tensile strength of the short fiber reinforced polymer16,22,23 and studied the elastic modulus depending on FLD and FOD with the use of probability density function and laminate analogy approach.24-26 Shen confirmed the 3-D shape of the glass fiber (GF) in the short fiber-polymer composite foam using X-ray micro-CT and represented it in connection with the Weibull distribution by measuring both length and angle of the GF.27,28 Alemdar represented the fiber size distribution of natural fibers as a function of probability density after injection molding of polypropylene (PP) composites with natural fiber using X-ray micro-CT.29 Besides, many researchers have used a statistical method that expressed the FLD and FOD of fibers as a probability density function such as the Weibull distribution.
In the previous research,1-9 the theoretical study has been carried out assuming that the fiber orientation of the dumbbell specimen span formed by injection molding was uniaxial. In recent years, studies have been conducted to predict the FLD and FOD as a probability density function considering the fiber angle with an X-ray micro-CT device.27-29 In this work, we were able to obtain information about the tilt angle shape of the fiber in a 3-D way inside the tensile specimen by using non-destructive X-ray micro-CT, confirmed whether orientation of the fiber was uniaxial or not, and measured FLD and FOD of GFs. Finally, the modulus of PP/GF composites using FLD and FOD of GFs measured and the modulus of composites calculated by Tandon and Weng’s theory were compared and analyzed.
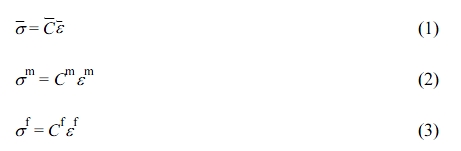
Micro-mechanics of PP Composites. According to Tandon and Weng, when a uniform strain occurs under ideal conditions due to the uniform stress acting on the surface of the composite, it is expressed as follows,6 where  is the mean volume stress,
  is the mean volume strain, and
  is the elastic modulus tensor of the composite. Also m and f represent the matrix and filler respectively and the elastic modulus of the matrix is denoted by Cm, and the modulus of the filler with the same orientation is expressed by Cf, since the properties of the matrix are influenced by matrix and filler, respectively.
Since the filler is present in the composite, the perturbed strain  must be considered, and the strain corresponding to the strain deformation of the filler can be expressed as εt, which follows Eshelby’s equivalent theory.1 The overall strain relationship between the filler and the matrix can be expressed as Eshelby’s transformation strain, εt.

Here  and
and  are perturbed stresses and strains, respectively. The average perturbed stress of the matrix and filler is extinguished on average, so the following equation can be obtained, where φ is the volume fraction of the filler.

The deformation value,  , representing the average change of the filler, is expressed as follows.
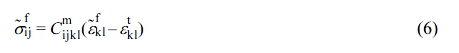
Here  is the perturbed strain of the filler due to the average strain given to the matrix. By considering the Eshelby tensor, Sijkl, and Hill’s2 proposal, the transformation strain,
  , caused by the deformation stress,
  , of the disturbed filler can be expressed as follows.
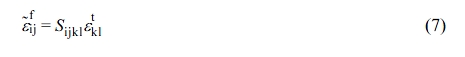
The equivalent transformation strain tensor (Sijkl) proposed by Eshelby can be expressed as in eq. (8).

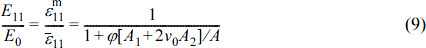
Here, the quadratic elastic tensors of the matrix and filler are expressed as  and
and  . The longitudinal Young’s modulus is obtained by the value of
  .
.
Likewise to the case of the longitudinal Young’s modulus, the transverse Young’s modulus is as follows.
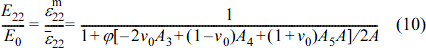
Here, A, A1, A2, A3, A4, and A5 are as shown in the documented literature.6
Transformation of Reference Axes from Principal Axes. The strain components, εx, εy and γxy can be defined by the angular transformation relation for the direction different from the existing axis, and its matrix form is as follows.
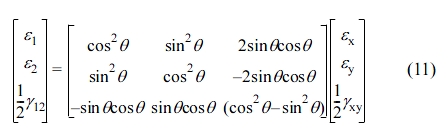
The transformation matrix of eq. (11) can be expressed using [T] and eq. (12) is obtained by using and rearranging the compliance matrix [S] that connects the stress-strain relationship of matter according to Hooke’s law.
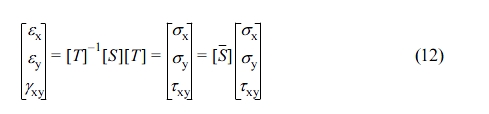
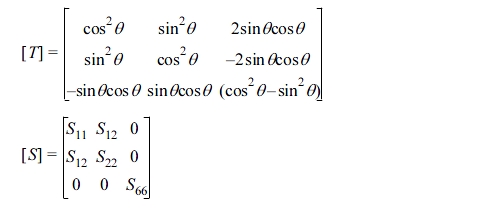
Here, [T] and [S] are as follows.
One of the components of  in eq. (12),
  , is expressed as follows.

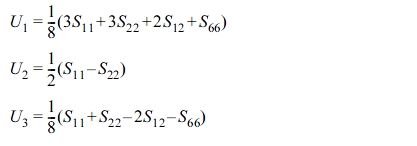
And U1, U2 and U3 are as follows.
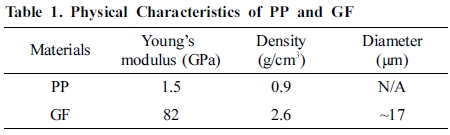
Materials. Supran® PP 1350, a long fiber reinforced thermoplastic (LFT) product manufactured by Sambark LFT Co., Ltd., and PP (Melt flow index: 35 g/10 min) SFR -171H from Lotte Chemical Co., Ltd. were used. Supran® PP 1350, a mixture of 50 wt% Owens Corning’s epoxy-sized GF (Advantex®) impregnated by LFT process, 48 wt% PP (SFR-171H), and 2 wt% PP (CM-1120), was pelletized so that the length of GF became 11 mm. PP (CM-1120) with a 1.0 wt% maleic anhydride graft ratio from Lotte Chemical Co., Ltd. was used as a compatibilizer to improve interfacial adhesion between PP and GF. The basic material information of PP and GF are shown in Table 1.
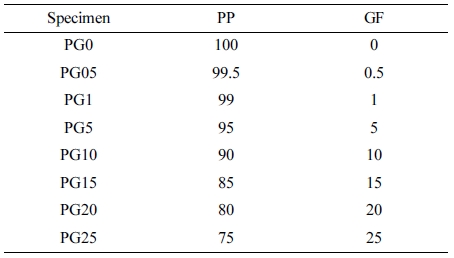
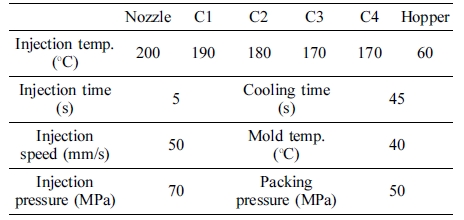
Specimen Preparation. The specimens for tensile test and X-ray micro-CT were injection molded by dry blending Supran® PP 1350 pellet and PP(SFR-171H) pellet to have the volume% composition of PP and GF shown in Table 2. A total of 8 specimens were prepared so that the content of GF was in the range of 0.5~25 vol%. The injection molding machine was a single screw type (Model: MD180W i6.5, Manufacture: Ube Machinery). The barrel temperature profile was set to a temperature range of 170 to 200 ℃ from the cylinder starting point (C4) to the nozzle and the injection time, injection speed, injection pressure, cooling time, mold temperature and packing pressure were shown in Table 3.
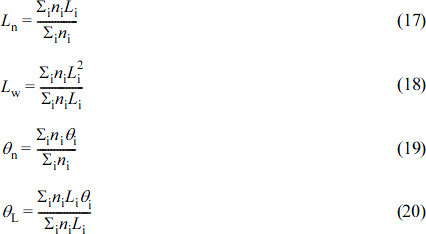
Micro-computed Tomography. X-ray micro-CT (SkyScan 1272, Bruker) was used to confirm the 3-D structure of the GF in the PP/GF composite. The X-ray beam source was 50 kV and the current was 200 μA. During scanning, the sample was rotated by a small angle (0.400o). After a bit more than a half circle (188.40o) was completed, the entire set of radiographs was synthesized by computer software to reconstruct a 3D image of microstructure. Figure 1 shows the specimen preparation and measurement method for X-ray micro-CT. Figure 1(a) shows the X-ray micro-CT specimen cut according to the site. We used a diamond cutter (Model: IsoMatTM Low speed saw, Manufacture: Buehler), which operated at a low speed without affecting the properties of the specimen. First, the dumbbell specimen was fixed on a diamond cutter and the micrometer was adjusted to fit the diamond cutter wheel and then bisected in the flow direction. Three specimens of 1.5×3×10 mm were prepared by dividing the span of one part of the bisected dumbbell specimen into three parts toward the flow direction of the resin. The cut specimen names were named W1, W2, and W3. Note that W1 is the skin part of the dumbbell specimen, W2 is the transition part, and W3 is the core part. Figure 1(b) shows the specimen in the front, top, and right directions in order to compare the 2-D images viewed from each direction of the specimen during the tomography of the hexagonal specimens W1, W2 and W3 with the X-ray micro-CT. Figure 1(c) shows the front, right, and top surfaces.
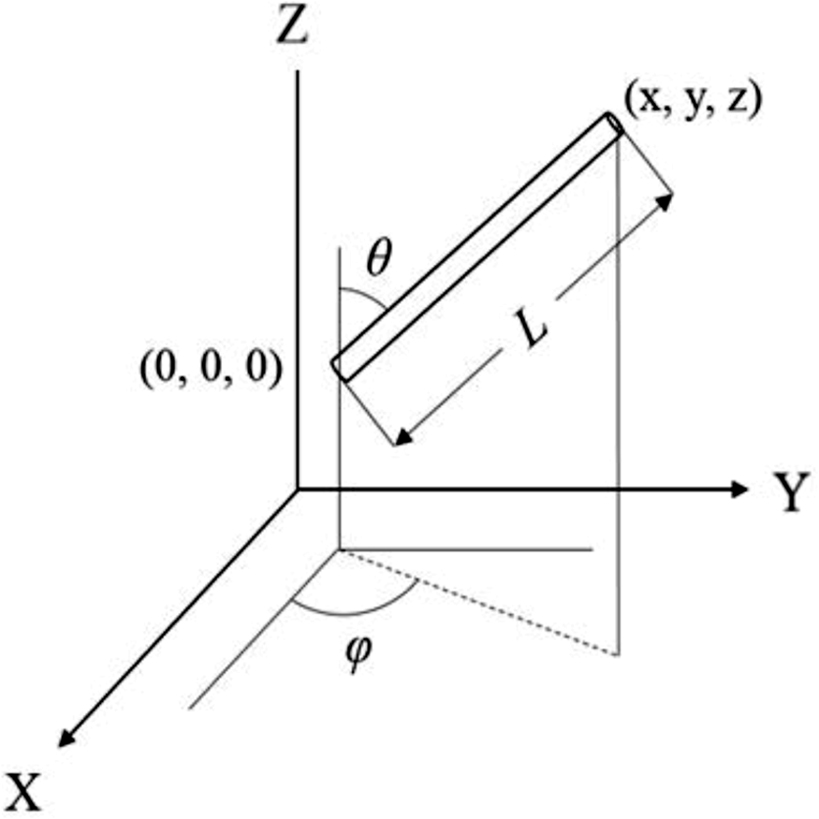
Calculation of Fiber Length and Orientations. Rhinoceros 5.0 (Rhino 3D) software was used to get the Cartesian coordinates of each of the GF in a 3-D image obtained by tomography with X-ray micro-CT. To obtain the length of the fiber in detail, one end of the fiber of 3-D image was moved to the zero point of the Cartesian coordinates system, and the (x, y, z) coordinates at the other end were obtained. From the identified (x, y, z) coordinates of each of the fibers, the length of the fiber in Figure 2 was determined via eq. (14), where L is the length of the fiber.

The distribution of L is important to the mechanical properties of product, because of fiber breakage during injection process. The Cartesian coordinates (x, y, z) were converted to spherical coordinates (L, θ, φ) to calculate the inclination angle of the fiber. Figure 2 shows the relationship between coordinates (x, y, z) and (L, θ, φ). The angle between the fiber and the Z axis, where the fiber is at an angle deviated from the central axis of the resin, θ, and the angle φ between the line projected on the XY plane and the X axis were obtained from eqs. (15) and (16).
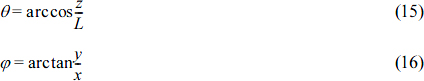
Firstly, the mechanical properties of the injection-molded polymer composite depend on the length distribution of the fiber in the composite. Therefore, the average value of the fiber length, the number average length and the weight average length were calculated. Second, since the mechanical properties of the polymer composite depend on the tilt angle of the fiber, the number average tilt angle and the average tilt angle weighted with length were calculated. The number average length (Ln), weight average length (Lw), number average tilt angle (θn), and average tilt angle weighted with length (θL) were calculated for the measurement of the length and angle distribution of the GF in the PP composite by the following eqs. (17)-(20) respectively, where i represents the number of individual fiber.
Mechanical Properties. The mechanical property measurement of PP/GF composites was carried out in accordance with ASTM D638 and the crosshead speed was 5 mm/min (strain interval: 0.05~0.25%). Tensile modulus measurement was carried out using a universal testing machine (UTM) (Galdabini Quasar 10).
|
Figure 1 Injected specimen for X-ray micro-CT measurements: (a) dumbbell specimen of tensile bar; (b) sample cut from dumbbell specimen on the stage of X-ray micro-CT; (c) sample cut from dumbbell specimen with flow direction. |
|
Figure 2 Cartesian and spherical coordinate systems. |
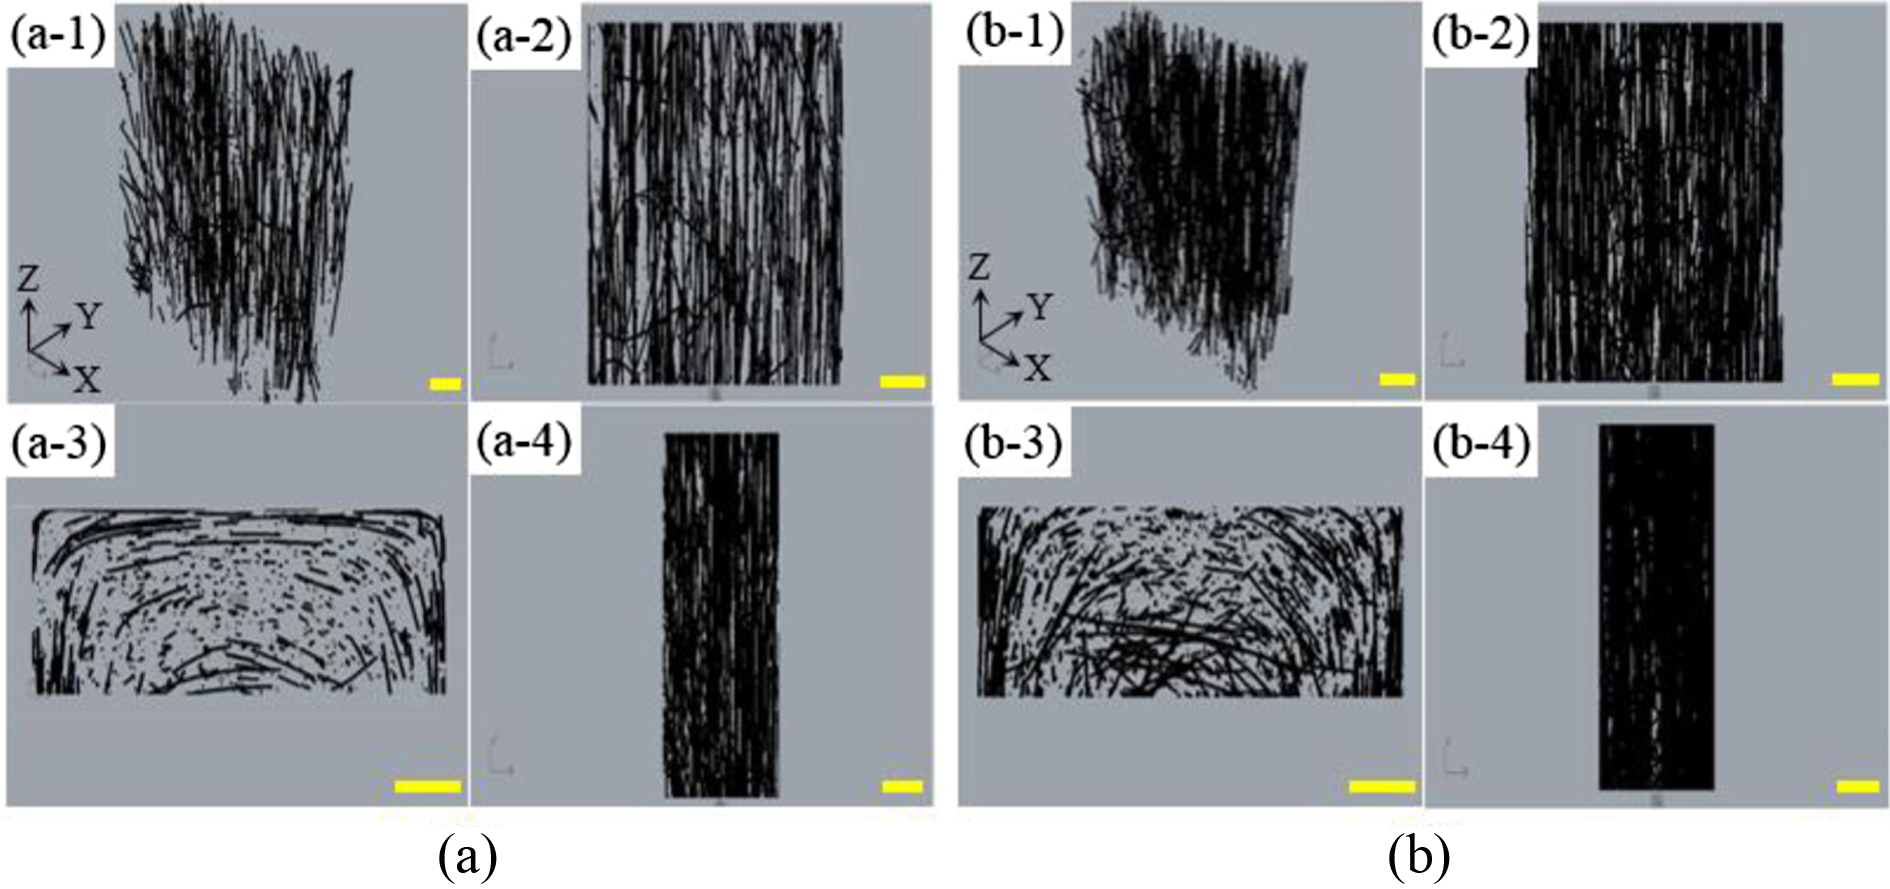
X-ray micro-CT 2-D and 3-D Images of Specimens. To investigate the internal fiber distribution of specimens, the 2-D micro-CT images viewed from the front, top, and right directions, and the 3-D images are shown in Figure 3. Figure 3(a) in which about 330 GFs are distributed shows image of W1 (skin) specimen containing 0.5 vol% of GF. Figure 3(a-1) is a 3-D image showing that GFs were aligned in the resin flow direction together with some off alignment. This observation gave an information that there were fibers deviating from the uniaxial orientation in the axial direction. Also in the 2-D right view of the specimen (Figure 3(a-2)), most of the GFs were aligned in the flow direction with some off alignment. In Figure 3(a-3) viewed from the top direction of the specimen, fibers deviating from the flow direction were observed with a line, with GF aligned in the direction of the flow shown by the dot. As the GF moved away from the axial direction, the fiber rotated along the flow of the resin, and it could be seen that the fountain flow phenomenon occurred. The front view image of the specimen, Figure 3(a-4), was not much different from front view image shown in Figure 3(a-2). Figure 3(b) are images of W1 (skin) specimens containing 1.0 vol% of GF and showed a similar tendency as was in Figure 3(a), but it showed a more denser fiber distribution due to the higher GF content.
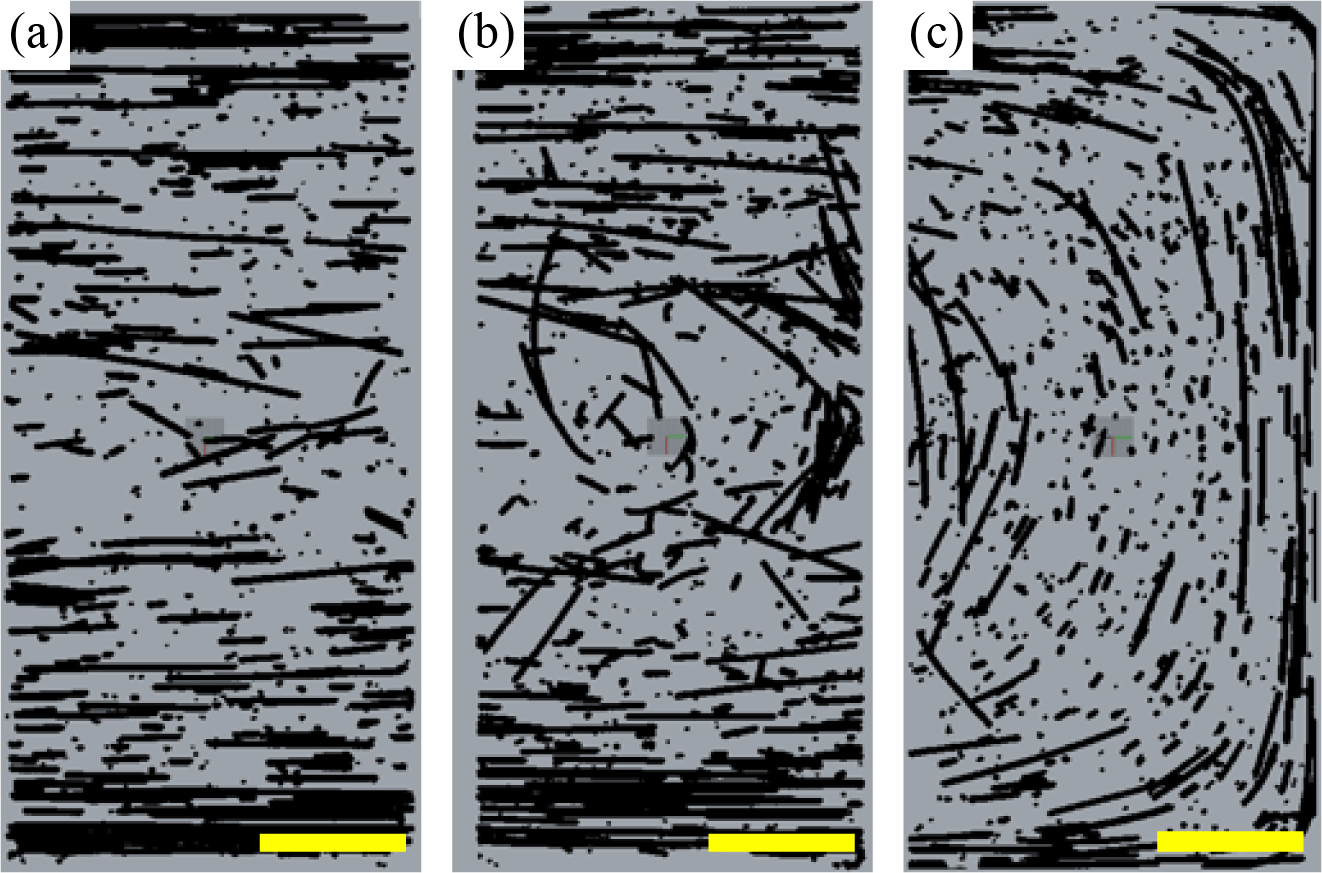
In order to investigate the distribution of GF in the dumbbell specimen as a whole, the 2-D top view images to the resin flow for the W1, W2 and W3 specimens of the PP complex containing 0.5 vol% GF are shown in Figure 4. In the case of W1 (skin) shown in Figure 4(c), GF was seen to be in a line shape along the surface of the mold, while inside it showed a dot shape aligned in the resin flow direction. W3 (core) in Figure 4(a) and W2 in Figure 4(b) showed that the line shapes of GFs tilted along the surface of the mold were greater than those of W1, and the dot shapes inside were less than those of W1. Therefore, the average tilt angle of GF was expected to be smaller at W1 (skin) and larger at W3 (core) and W2. Since W1 (skin) was in contact with three mold surfaces, quenching proceeded quickly at the early stage, and therefore it was predicted that the average length of the fibers in W1 (skin) was longer than W2 and W3, due to less breakage of fibers.30 As a result, the fibers seemed to be tilted along the resin flow direction due to the influence of the mold wall surface, confirming that the fountain flow existed. This flow phenomenon had been also observed by previous researchers.31-33
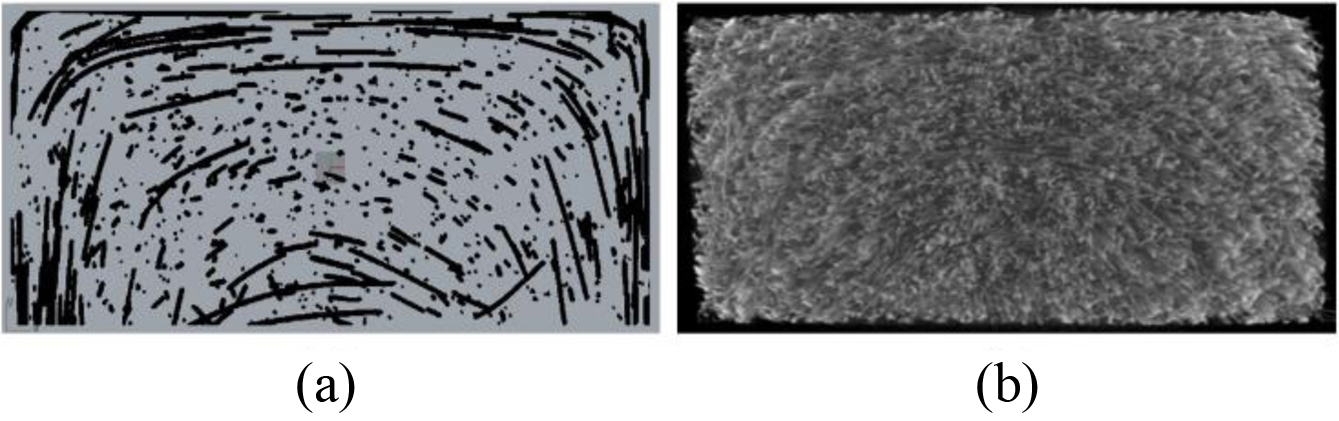
In order to compare the fiber distribution at low and high GFs from dumbbell specimen of the PP/GF composite, a 2-D top view image with 0.5 vol% GFs and a 3-D top view image with 20 vol% GFs were shown in Figure 5. In Figure 5(a), we could clearly observe the distribution of the tilt fibers along the resin flow direction. However, in Figure 5(b), though we could confirm that the fibers were arranged according to the resin flow direction similarly as was in Figure 5(a) (0.5 vol% GF), clear distribution of fibers could hardly be seen due to too high concentration of GFs (20 vol% GF). We could observe the similar fountain flow behavior of GF distributions up to 20 vol% composite by X-ray micro-CT.
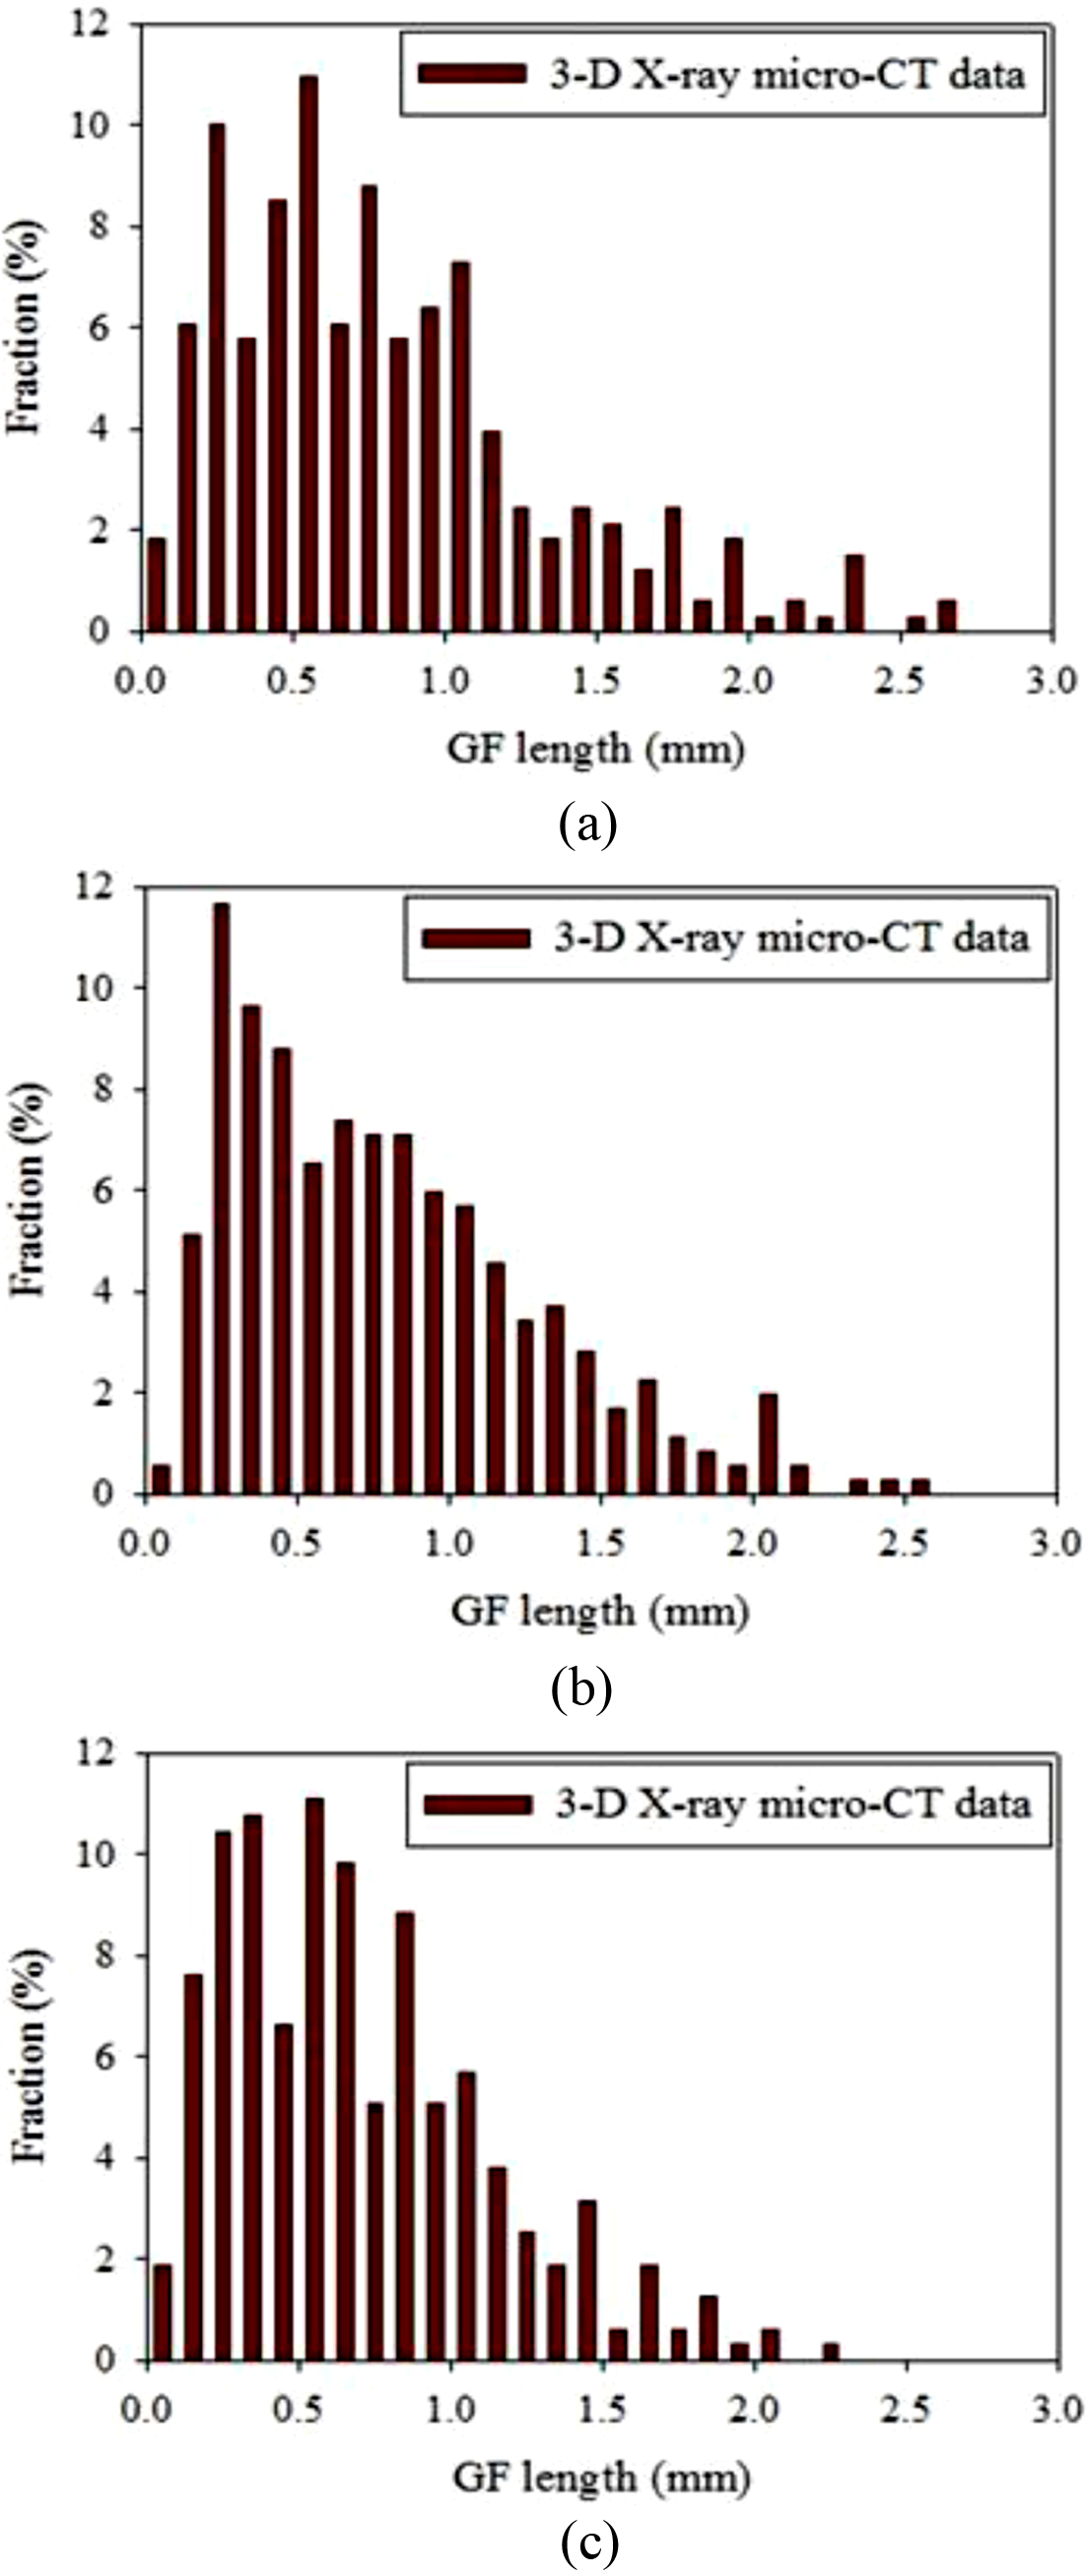
Fiber Length Distribution (FLD). After X-ray CT measurements, the lengths of the fibers analyzed by Rhinoceros software were classified in 0.1 mm increments and are shown in Figure 6 as a fraction of the total number.
Figure 6(a) is the length distribution of W1 (skin) specimen containing 0.5 vol% GF. GF length measurements showed various length distribution ranging from 0.08 to 2.64 mm. The number average length was 0.810 mm, the weight average length was 1.172 mm, and the ratio of the weight average length to the number average length was 1.447. The GF length before injection was ca. 11 mm on average, but the GF breakage occurred during the molding process with the injection machine and the distribution shown as in Figure 6(a) was obtained.
For W2 in Figure 6(b), the GF length distribution ranged from 0.08 to 2.54 mm. Here the number average length was 0.796 mm, the weight average length was 1.114 mm, and the ratio of the weight average length to the number average length was 1.399. In W3 (core) of Figure 6(c), the GF length ranged from 0.08 to 2.54 mm, the number average length was 0.701 mm, the weight average length was 0.981 mm, and the ratio of weight average length to number average length was 1.399.
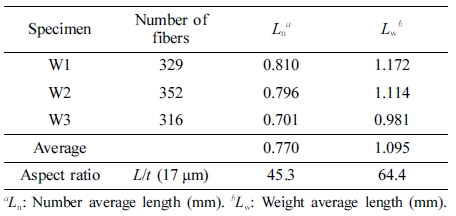
Table 4 summarizes the number average length and weight average length of PP specimens containing 0.5 vol% GF. The number average length and weight average length of the total fibers were 0.770 mm and 1.095 mm, respectively, and the aspect ratios of the GF having a diameter of 0.017 mm were 45.3 based on the number average length and 64.4 based on the weight average length. The number average length and weight average length of W1 (skin) were the longest and W3 (core) were the smallest. A suitable explanation for the results might be orientation in the flow direction and early quenching, and accordingly W1 (skin) had the longest weight average length (1.172) as shown in Table 4.
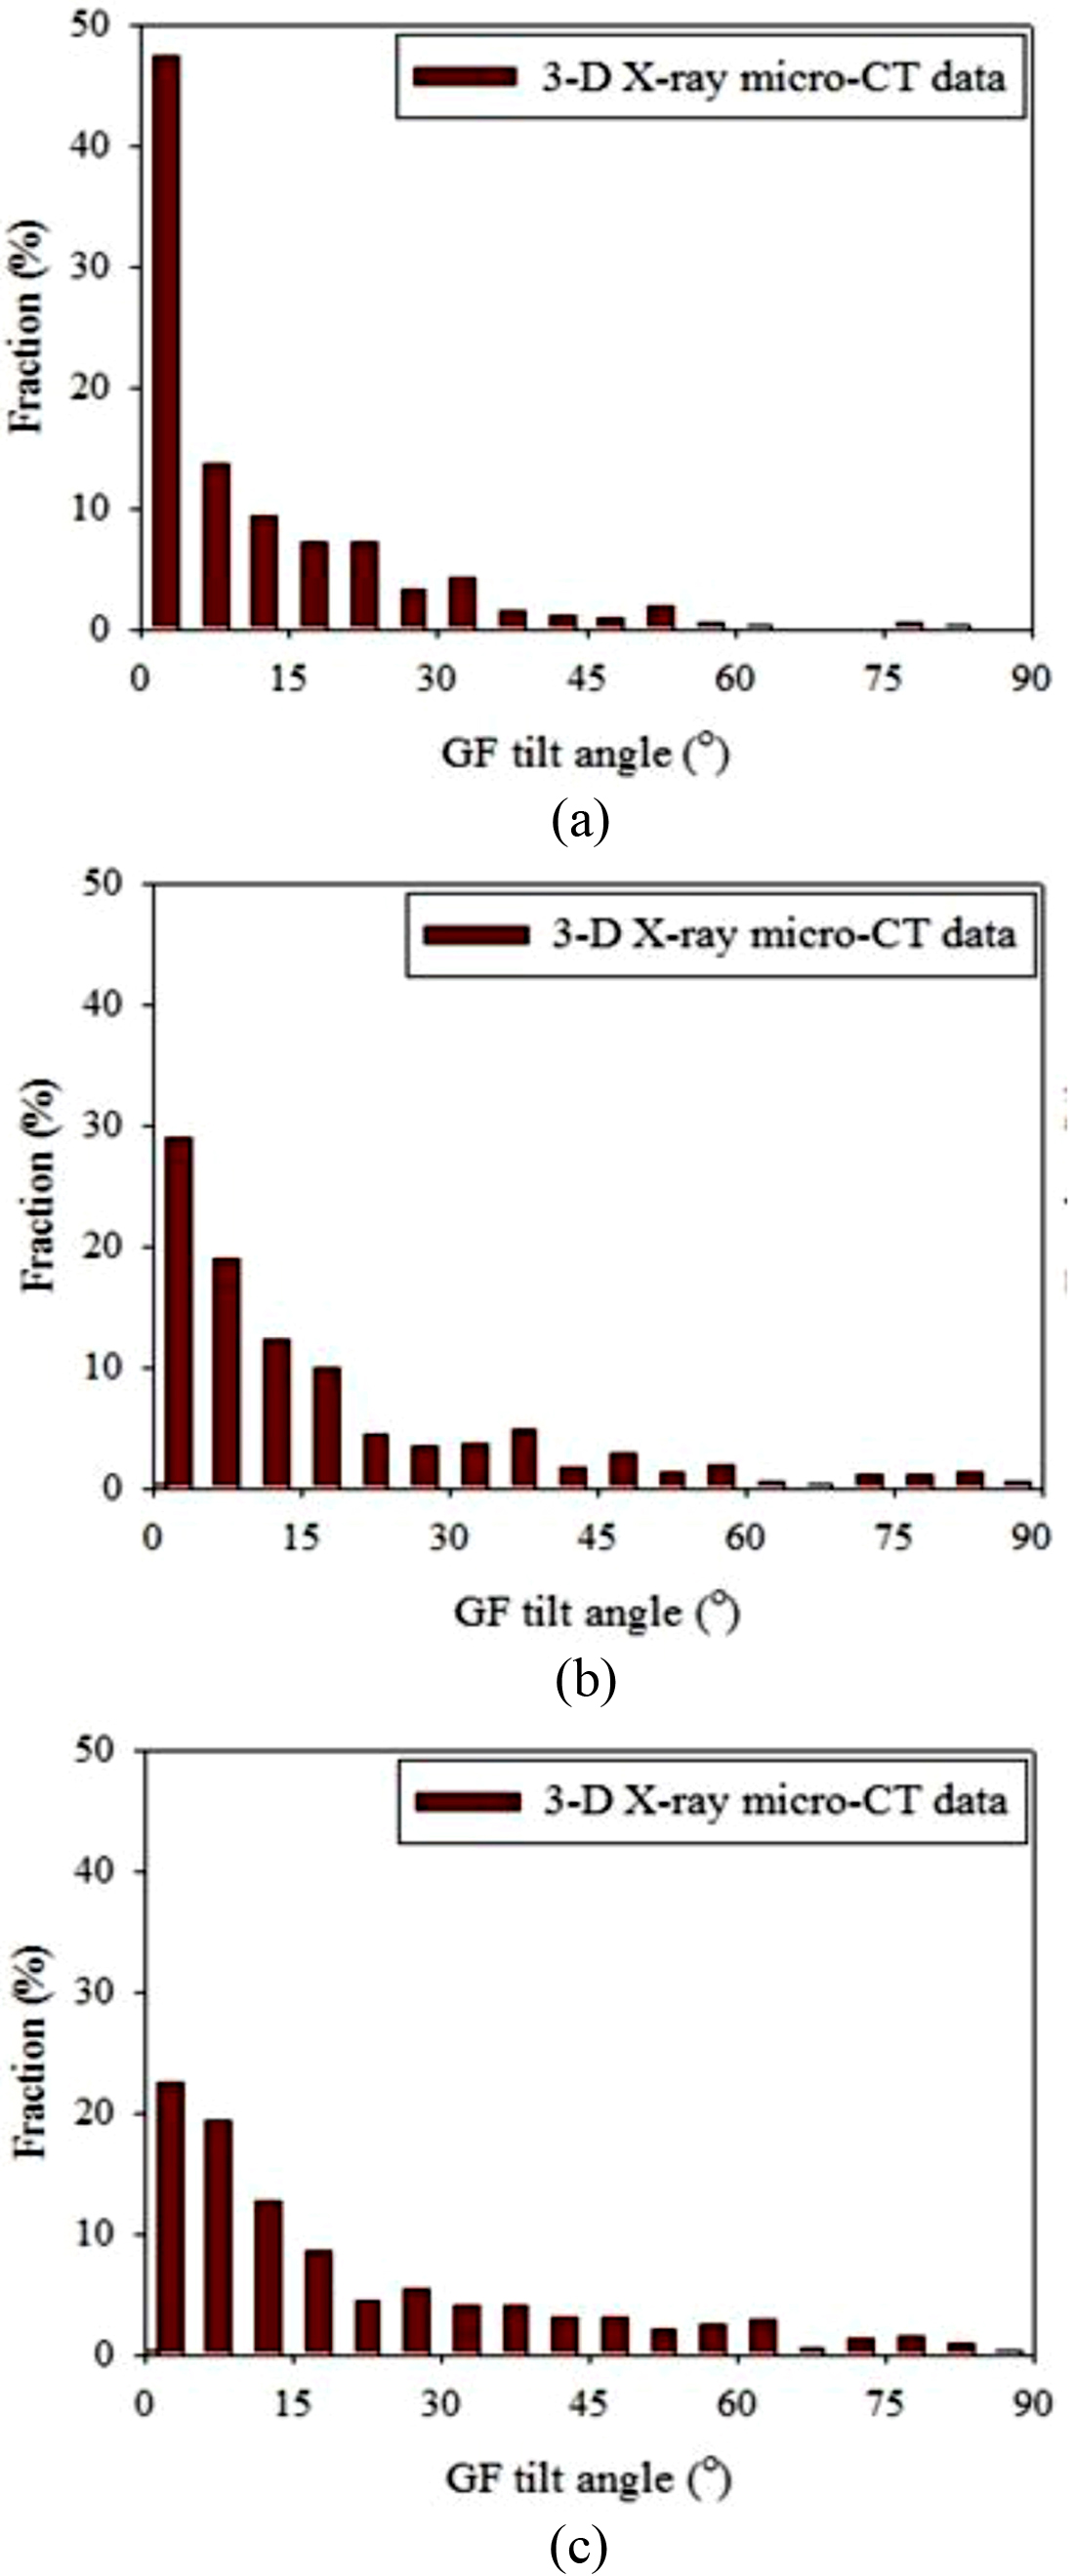
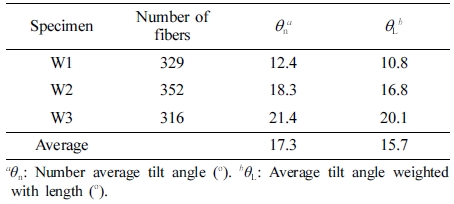
Fiber Orientation Distribution (FOD). Figure 7 shows the distribution of the tilt angle (θ) between the fibers in the dumbbell specimen containing 0.5 vol% GF and the axial direction (z-direction). The orientation of the fibers was expressed as a fraction of the number of fibers included in the angle range relative to the total number of fibers in 5o units.
In Figure 7(a), W1 (skin) occupied the largest proportion (47%) in the range of 0o to 5o of the total fibers, which accounted for a large proportion of fibers tilted along the axial direction of the dumbbell specimen span. The rest of it had a wide distribution up to 80.24o, the number average tilt angle was 12.4o, and the average tilt angle weighted with length was 10.8o. It could be judged that most of the fibers were tilted along the flow direction of the resin.
W2 in Figure 7(b) accounted for the largest fraction of 27% at 0~5o similarly as W1 and had a wide distribution up to 85.79o. The number average tilt angle was 18.3o and the average tilt angle weighted with length was 16.8o. W3 (core) in Figure 7(c) showed the largest fraction of about 22.5% at 0~5o, a wide distribution up to 86.62o. And the number average tilt angle was 21.4o and the average tilt angle weighted with length was 20.1o.
Table 5 summarizes the number average tilt angle and average tilt angle weighted with length. The number average tilt angle of total fibers was 17.3o and the average tilt angle weighted with length was 15.7o. As was discussed in Figure 4 for the number average tilt angle and the average tilt angle weighted with length, W3 (core) had the greatest value (θL=20.1o), while W1 (skin) showed the smallest value (θL=10.8o).
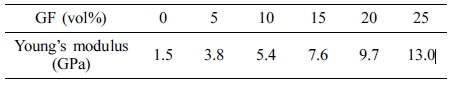
Experimental Results and Theoretical Prediction of Young’s Modulus. The dumbbell-type tensile specimen was prepared by injection molding of a PP/GF composite, and the actual Young’s modulus of each GF was measured in terms of vol% as shown in Table 6. The Young’s modulus of pure PP resin was 1.5 GPa and the PP/GF (25 vol%) composite showed 13.0 GPa. As the content of GF increased, Young’s modulus increased proportionally.
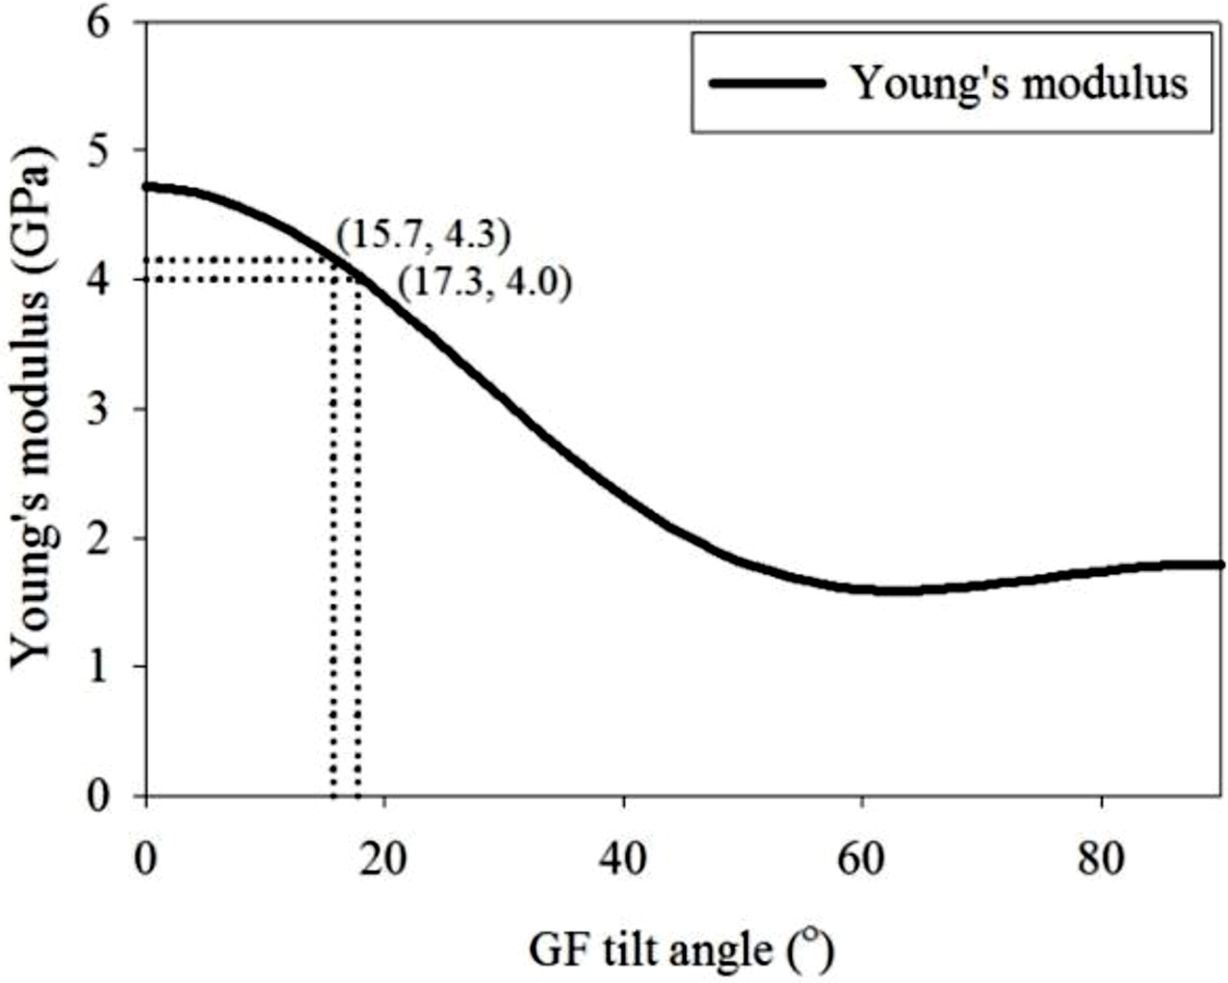
The aspect ratio value (45.3) obtained from the number average length distribution of PP/GF (0.5 vol%) composite by X-ray micro-CT was used to predict the physical properties in terms of the glass fiber content of unidirectionally oriented PP composite using the Tandon and Weng theory. As a result, Young's modulus of PP composite tended to increase with increasing GF content. When the content of GF was 5 vol%, it was 4.7 GPa, 7.8 GPa at 10 vol%, 14.1 GPa at 20 vol%, and 17.3 GPa at 25 vol%. The compliance matrix [S] could be calculated using these and the Young’s modulus of the composite according to the tilt angle was calculated on the average within the GF 5 vol% PP composite and are presented in Figure 8.
At the number average tilt angle of 17.3o and at the average tilt angle weighted with length of 15.7o in a PP composite containing 0.5 vol% of GF, Figure 8 showed theoretical calculations of the Young’s modulus of the GF 5 vol% PP composite to be 4.0 GPa and 4.3 GPa, respectively. These results indicated that Young’s modulus decreased as the degree of fiber tilt increased, considering the Young’s modulus value of 4.7 GPa obtained by assuming that GF was aligned unidirectionally.
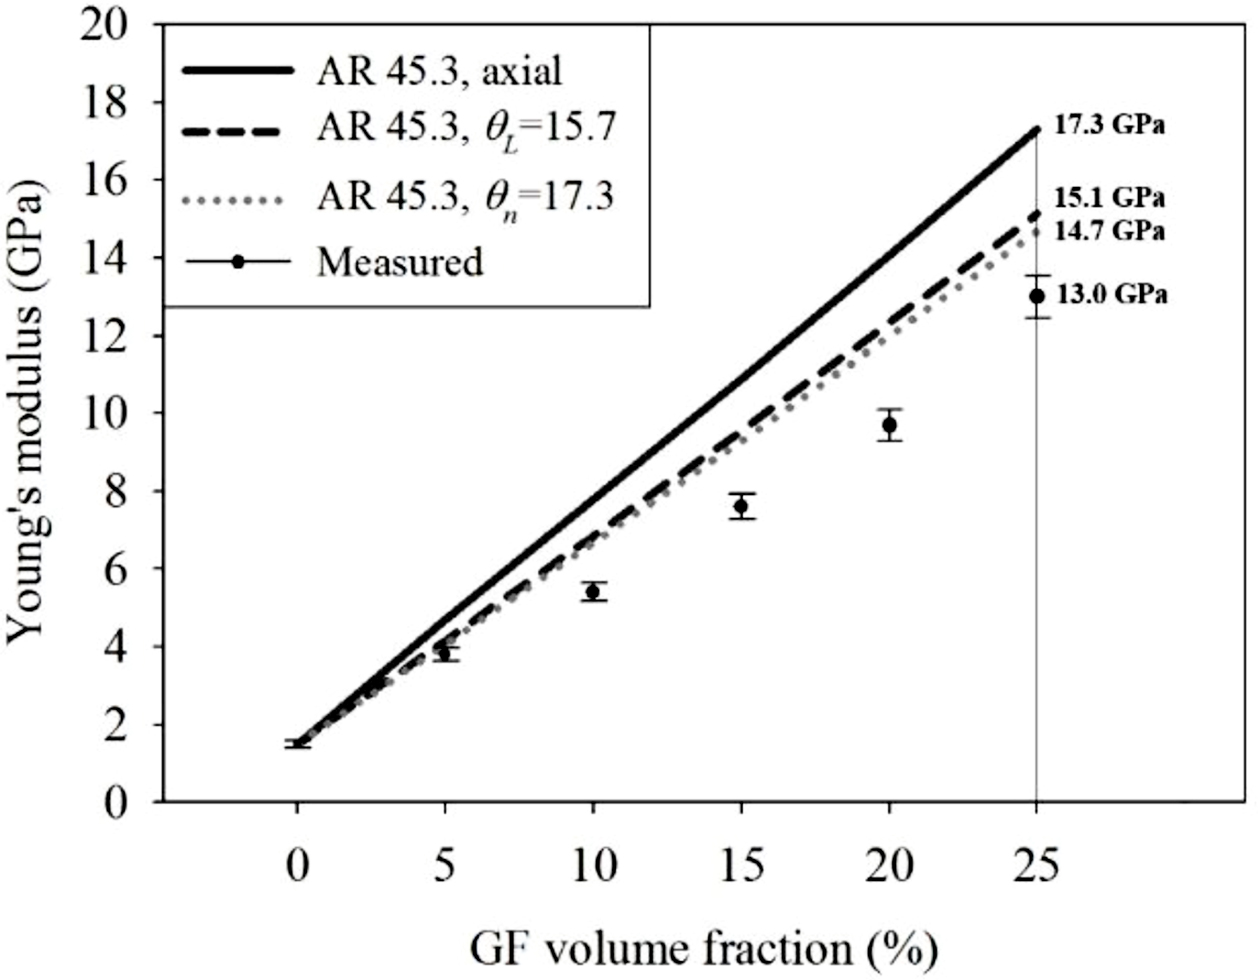
Comparison of Experimental Data and Simulated Young’s Modulus. In Figure 9, the simulated modulus values of three cases were compared with the measured modulus values for the volume fraction of GF in PP composites. That is, solid line was obtained by assuming the uniaxially tilted fibers in the axial direction, dashed line was obtained by applying the average tilt angle weighted with length 15.7o, and dotted line was obtained by applying the number average tilt angle 17.3o. Closed circle was experimentally measured modulus.
When applying the aspect ratio of 45.3 in the PP composite containing 25 vol% of GF and assuming the uniaxial orientation, the Young’s modulus value was theoretically 17.3 GPa, and the actual measurement value was 13.0 GPa and the difference was 4.3 GPa.
The Young’s modulus of the tilted fibers with a number average degree of 17.3o (degree) was theoretically 14.7 GPa, so the difference from the actual measured value of 13.0 GPa was 1.7 GPa. This showed that the difference between the theoretical and measured values decreased from 4.3 to 1.7 GPa when the number average angle was applied, compared to when uniaxial orientation was used. The result of our study combining X-ray micro-CT and Tandon and Weng theory suggested that it might be possible to provide a theoretical prediction that are close to the actual measurement value, given the fact that fibers in the span region of the dumbbell specimens are not uniaxially oriented but are inclined at a certain angle.
The main reason for the difference between the calculated modulus based on the tilt angle and the experimental modulus might be that the Tandon and Weng theory fails to interpret the actual value explicitly by using the assumption that the fiber and matrix are completed bonded. In order to obtain theoretical predictions more consistent with the experimental modulus, the theoretical development that supplements the assumption and the theory to predict the properties of the locally bonded composite would need to be developed.
|
Figure 3 2-D and 3-D visualizations of W1 cut from dumbbell specimen of PP/GF composite (refer to Figure 1): (a) 0.5 vol%; (b) 1.0 vol% GF. {(1) 3D-perspective (2) 2D-right (3) 2D-top and (4) 2D-front views} (scale bar: 0.5 mm). |
|
Figure 4 Combined 2-D top views of PP/GF (0.5 vol%) composite: (a) W3; (b) W2; (c) W1 (scale bar: 0.5 mm). |
|
Figure 5 The 2-D and 3-D top views of W1 cut from dumbbell specimen of PP/GF composite, respectively: (a) 0.5 vol%; (b) 20 vol% GF. |
|
Figure 6 GF length distributions in the PP/GF (0.5 vol%) composite: (a) W1; (b) W2; (c) W3. |
|
Figure 7 GF orientation distributions as a function of the tilt angle (o) in the PP/GF (0.5 vol%) composite: (a) W1; (b) W2; (c) W3. |
|
Figure 8 Calculated Young’s modulus values (GPa) as a function of GF tilt angle (o) for the PP/GF (5 vol%) composite at the aspect ratio 45.3 based on number average length. |
|
Figure 9 Calculated and experimental modulus values (GPa) of the PP composites as functions of GF volume fraction for tilt angles (o) at the aspect ratio 45.3 based on number average length. |
|
Table 5 Number Average Tilt Angle and Average Tilt Angle Weighted with Length of GF in the PP/GF (0.5 vol%) Composite |
|
Table 6 Experimental Moduli (GPa) in terms of the GF vol% for the PP/GF Composite |
In this study, we used X-ray micro-CT images to analyze FLD and FOD in PP/GF composites. The geometry of the length and orientation of GF in the PP/GF composite was visualized by X-ray micro-CT images, and the fiber length distribution and tilt angle were measured and reported depending on the position in the mold. It was observed that the GF in the mold appeared along the flow direction of the fountain flow, which was observed even when GF reached to 20 vol%. Based on 2-D images, the tilt angle of GF in W1 (skin) was smaller and the length distribution was longer which could be seen in the form of a dot in the skin layer.
In conclusion, when the span part of the injection specimen molded with the LFT pellet with the GF initial length of 11 mm was observed as a whole, the FLD data of the entire specimen were as follows, i.e., the number average length (Ln) was 0.770 mm (AR=45.3) and the weight average length (Lw) was 1.095 mm (AR=64.4). For FOD data, the number average tilt angle (θn) was 17.3o and the average tilt angle weighted with length (θL) was 15.7o. In this study, we were able to demonstrate that the theoretical predictions based on the tilt angle were closer to the actual measurements than the assumption that GFs were aligned uniaxially oriented.
- 1. J. D. Eshelby, Proc. Roy. Soc. Lond. A, 241, 376 (1957).
-

- 2. R. Hill, J. Mech. Phys. Solids, 11, 357 (1963).
-
- 3. T. Mori and K. Tanaka, Acta Metall., 21, 571 (1973).
-
- 4. J. C. Halpin, Effects of Environmental Factors on Composite Materials, Technical Report AFML-TR-67-423, OHIO, 1969.
-
- 5. J. C. Halpin, Primer on Composite Material Analysis, CRC Press, Florida, 1992.
-
- 6. G. P. Tandon and G. J. Weng, Polym. Compos., 5, 327 (1984).
-
- 7. P. J. Yoon, T. D. Fornes, and D. Paul, Polymer, 43, 6727 (2002).
-
- 8. K. Y. Lee, S. I. Joo, S. K. Jeoung, H. J. Jun, and K. H. Kim, Polym. Korea, 31, 206 (2007).
- 9. K. Y. Lee and D. R. Paul, Polymer, 46, 9064 (2005).
-
- 10. H. Bos, J. Müssig, and M. Van den Oever, Composites Part A, 37, 1591 (2006).
-
- 11. T. V. Khanh, J. Denault, P. Habib, and A. Low, Comp. Sci. Technol., 40, 423 (1991).
-
- 12. S. Y. Fu, X. Hu, and C. Y. Yue, Mater. Sci. Res. Int., 5, 74 (1999).
- 13. R. von Turkovich and L. Erwin, Polym. Eng. Sci., 23, 743 (1983).
-
- 14. J. Denault, T. V. Khanh, and B. Foster, Polym. Comp., 10, 313 (1989).
-
- 15. L. Biolzi, L. Castellani, and I. Pitacco, J. Mater. Sci., 29, 2507 (1994).
-
- 16. S.Y. Fu and B. Lauke, Composites Part A, 29, 575 (1998).
-
- 17. S. Y. Fu, B. Lauke, E. Mader, C. Y. Yue, and X. Hu, Composites Part A, 31, 1117 (2000).
-
- 18. H. Bijsterbosch and R. J. Gaymans, Polym. Comp., 16, 363 (1995).
-
- 19. P. T. Curtis, M. G. Bader, and J. E. Bailey, J. Mater. Sci., 13, 377 (1978).
-
- 20. D. M. Bigg, Polym. Comp., 6, 20 (1985).
-
- 21. K. Takahashi and N. S. Choi, J. Mater. Sci., 26, 4648 (1991).
-
- 22. M. R. Piggott, J. Comp. Mater., 28, 588 (1994).
-
- 23. P. A. Templeton, J. Reinf. Plast. Comp., 9, 210 (1990).
- 24. S. Y. Fu and B. Lauke, Compos. Sci. Technol., 56, 1179 (1996).
-
- 25. W. K. Chin, H. T. Liu, and Y. D. Lee, Polym. Comp., 9, 27 (1988).
-
- 26. F. Ularych, M. Sova, J. Vokrouhlecky, and B. Turcic, Polym. Comp., 14, 229 (1993).
-
- 27. H. Shen, S. Nutt, and D. Hull, Compos. Sci. Technol., 64, 2113 (2004).
-
- 28. J. C. Tan, J. A. Elliott, and T. W. Clyne, Adv. Eng. Mater., 8, 495 (2006).
-
- 29. A. Alemdar, H. Zhang, M. Sain, G. Cescutti, and J. Mussig, Adv. Eng. Mater., 10, 126 (2008).
-
- 30. J. Ryu and M.-Y. Lyu, Int. Polym. Process., 29, 3 (2014).
-
- 31. C. G. Gogos, C.-F. Huang, and L. R. Schmidt, Polym. Eng. Sci., 26, 1457 (1986).
-
- 32. D. J. Coyle, J. W. Blake, and C. W. Macosko, AIChE J., 33, 1168 (1987).
-
- 33. X. Jin, Polym. Eng. Sci., 33, 1238 (1993).
-

- Polymer(Korea) 폴리머
- Frequency : Bimonthly(odd)
ISSN 0379-153X(Print)
ISSN 2234-8077(Online)
Abbr. Polym. Korea - 2023 Impact Factor : 0.4
- Indexed in SCIE
 This Article
-
2019; 43(3): 465-474
Published online May 25, 2019
- 10.7317/pk.2019.43.3.465
- Received on Feb 22, 2019
- Revised on Mar 19, 2019
- Accepted on Mar 19, 2019
Services
Shared
Correspondence to
- Kee Yoon Lee
-
Dept. of Polymer Science and Engineering, Chungnam National Univ., 99 Daehak-ro, Yuseong-gu, Daejeon 34134, Korea
- E-mail: kylee@cnu.ac.kr
- ORCID:
0000-0003-4920-5931
Hyecheon Building(Room 601), #354, Gangnam-Daero, Gangnam-Gu, Seoul 06242, Korea
TEL : 82-2-568-3860, 561-5203, 569-3860 FAX : 82-2553-6938 E-mail: polymer@polymer.or.kr