


- Non-isothermal Crystallization Behavior, Rheological and Thermal Conductive Properties of Recycled Polyethylene Terephthalate/Polyethylene Blends
Bin Yang†
 , Dan Wang, Qin-Ting Chen, Jin Chen, Kang Chen, Ji-Bin Miao, Jia-Sheng Qian, Ru Xia, and You Shi*
College of Chemistry & Chemical Engineering, Institute of High Performance Rubber Materials & Products, and Key Laboratory of Environment-Friendly Polymeric Materials of Anhui Province, Anhui University, Hefei 230601, China
*College of Polymer Science & Engineering, State Key Laboratory of Polymer Materials Engineering, Sichuan University, Chengdu 610065, Sichuan, China- 재활용 폴리에틸렌테레프탈레이트/폴리에틸렌 블렌드의 비등온 결정화 거동과 유변학 및 열전도 특성
In this study, we prepared
series of recycled polyethylene terephthalate (RPET)/polyethylene (PE) blends
using melt extrusion. The effect of RPET content on crystallization behavior
and thermal conductive properties of the resultant blends were investigated
using differential scanning calorimetry (DSC), dynamic mechanical thermal
analysis (DMTA), etc. RPET was found to exert nucleating effect on the melt
crystallization of PE. The Agari model presented fairly reasonable
prediction of thermal conductivity as a function of RPET loading. The melt
cooling process was predicted with an enthalpy transformation method (ETM),
which is a well-established mean of evaluating the instantaneous heat
conduction of crystalline polymers/composites, and the obtained curves were
consistent with our experimental results. Besides, a four-parameter model (FPM)
was adopted coupled with an in-situ temperature measurement in order to
further disclose the solidification and crystallization kinetics of PE in the
presence of RPET in the blends.
The Agari model was fairly applicable in
prediction of the variation of thermal conductivity of PE/PET blend versus PE
volume fraction, in which formation of thermal network structure was clearly
revealed. The value of parameter F2 in the present work is
1.028, suggesting that it was easy for PE to form a thermal conductive
structure in the blend.

Keywords: melt blending, thermal properties, cooling behavior, recycled polyethylene terephthalate, polyethylene
The authors gratefully thank the financial support of the National
Natural Science Foundation of China (Nos. 51203002, 51273001) and the “211
Project” of Anhui University. The authors are also indebted to the kind supply
of materials from the Collaborative Innovation Center for Petrochemical New
Materials. Dr. L. Wang from Kyoto University is appreciated for helpful advice
for improvement of our work.
Polyethylene (PE) is one of the widely-used thermoplastics, and can be
produced into plastic tubing, film, electric cable and many other parts.1-4
PE is relatively inexpensive, exhibits good flexibility, ease processability,
and crystallinity, but possesses the disadvantages of low mechanical properties
and thermal stability.5 Polyethylene terephthalate (PET) is known as
the fourth-most-produced polymer after PE, polypropylene (PP) and polyvinyl
chloride (PVC), which is used in fibres for clothing, containers for liquids
and foods, thermoforming for manufacturing, and in combination with glass fibre
for engineering resins.6-12 Products based on plastic materials will
leads to environmental pollution if not properly managed (e.g.,
littering and incinerating).13,14 Thus, the recycling of industrial
plastics has been an ongoing practice in many industries.15,16
Research on the recycling and reuse of PET can be helpful to solve the
environment-related problems.17
In progress of the blend modification, Kordjazi et al. investigated
the rheological behavior of noncompatibilized and compatibilized PP/PET blends
with maleic anhydride-modified styrene-ethylene-butylene-styrene polymer, and
found that the storage modulus in plateau region increases by increasing the
concentration of the compatibilizer.18 Shields et al.
provided an easier insight into the mechanism of micro-/nano-fibril formation
in PE/PET and PP/PET blends by studying the morphology at various stages of
extrusion and drawing, and superior mechanical performance was achieved for
composites containing micro-/nano-fibril structure in comparison to raw blends.19
Chen et al. introduced the nanoclay incorporated with ethylene-glycidyl
methacrylate (E-GMA) compatibilizer into the recycled high-density polyethylene
(RHDPE)/RPET blends, and found that the flexural strength and modulus, thermal
stability increased gradually as the nanoclay content increased from 1% to 9%.20
Wan et al. designed the blends of PET/PP and ternary copolymer
ethylene–acrylic ester–glycidyl methacrylate (EAG) using a twin-screw extruder,
and it was observed that as the EAG content increased, the loss modulus and tan
δ values of PET in the PET/PP blends remained similar to those of neat PET and
the loss modulus and tan δ values of PP in the blends decreased gradually.21
Raffa et al. reported the chemical reactions among polymer and additives
showed a significant effect on the ultimate melt rheology and mechanical
properties of recycled PET (RPET)/polyolefin blends.22 Chen et al.
studied HDPE/RPET/rice husk (RH) composites through melt blending, and found
that the tensile and flexural properties, water absorption and
three-dimensional swelling of the resultant composites remarkably increased
with increasing RH content.23 The presence of RPET could
significantly increase the thermal stability of the blend samples.24,25
Present manuscript investigates the PE/RPET blends were prepared using
melt mixing method to study the crystallization behavior, rheological behavior
and solidification kinetics of the resultant blends via DSC, DMTA,
rheological characterizations, etc. In this study, our findings showed
that the presence of RPET showed nucleating effect on the crystallization of
PE. The cooling process was analyzed using an enthalpy transformation method
(ETM), which had proved to be an effective method for the prediction of
instantaneous heat conduction of crystalline polymers (especially applicable
for crystal morphological studies), e.g., PE,26,27 PP,28
PP/EPDM blend,29,30 etc. In addition, a four-parameter model
(FPM) was also utilized to investigate the solidification and crystallization
kinetics of the blends on the basis of the experimental results from an in-situ
temperature measurement. Classical thermal conduction models were compared
with the experimental thermal conductivity. The present work has practical
significance for the further research on the “processing-structure-property”
relationship of polymer blends as well as the extension of the application
fields for RPET.
Materials. Recycled PET
(RPET), with a density of 1.38 g/cm3 and melting point is
256 oC, was provided by Jinzhang (Taihu) Technology. Co.,
China. The melt flow index (MFI) of the RPET flakes was 27.5 g/10 min
(at a load of 2.16 kg according to the GB/T 3682-2000). Polyethylene (PE)
were purchased from Qilu (Shandong) Petroleum and Chemical Co., China (model:
F182PC), with a MFI of 2.4 g/10 min, a solid density (r) was 0.920 g/cm3 and melting point is
108.4 oC.
Sample
Preparation Procedures. The RPET samples
were dried in a drying oven set to 50 oC for 12 h. RPET and PE
were first physically blended according to a certain ratio, and then added to a
twin-screw extruder (model: SHJ-20, Nanjing Jieya Extrusion Equipment Co.,
China) for melt blending to produce blends (temperature process: 235, 255, 260
and 275 oC). Formula designed for this work: S0 is neat PE, the
content of RPET in S1 is 22% and the content of S2 is 28%, S3 is RPET.
Dynamic
Rheological Measurement. A
strain-controlled rheometer (model: Bohlin Gemini-200, Malvern Instruments
Ltd., U.K.) was used to characterize the dynamic rheological properties in a
dynamic sweep mode. A 25.0-mm diameter parallel-plates geometry was used to
prepare samples, and then disc samples of different compositions were measured
at 285 oC. Prior to dynamic shear rheological measurements, a
strain sweep test at a constant frequency of 1.0 Hz determined the linear
visco-elastic region. After ascertaining the flow behavior, the samples
subjected to dynamic oscillatory sweep from 0.01 to 100 Hz.
Differential Scanning Calorimetry (DSC) Measurements. The crystallization behaviors for the samples were
studied utilizing a differential scanning calorimeter (DSC), Model: Q-2000,
pruduct of TA Instruments Inc., USA. During the measurement, each sample
weighed 3~5 mg was sealed in the aluminum pans within nitrogen (N2)
atmosphere whose flow rate was 50 mL/min. The sample was heated from room
temperature to 270 oC at a rate of 10 oC/min
and kept at 270 oC for 4 min (to eliminated thermal
history), and then cooled to room temperature at a rate of 2.5 oC/min.
The crystallization behavior of the samples with a cooling rate of 5, 10,
20 oC/min was measured in this way. The crystallization
behavior of the sample was analyzed by heat flow curve.
Dynamic
Mechanical Thermal Analysis (DMTA). The DMTA tests for
all samples were carried out on a DMA Q-800 instrument (a product of TA
Instruments Inc., USA). The experiments were conducted in single/dual
cantilever mode under isochronal conditions at a frequency of 1.0 Hz at a
heating rate of 3.0 oC/min at controlled amplitude of
15.0 μm. The samples was pressed into a rectangular shape with dimensions
about 100×10×2 mm3 at 270 oC. The storage
modulus (E') and loss modulus (E'') of the samples were measured
as a function of temperature. At least three samples were tested for each
component, and the results were taken as the average of the test samples.
Vicat
Softening Temperature. Vicat softening
temperature (VST) is a temperature at which a flat-ended needle of 1 mm2
circular cross section penetrates the specimen to a depth of 1.0 mm under
specified conditions.31 In this work, the VST value was measured
according to GB1634-2000 with a load of 1.02 kg at a heating rate
of 120 oC/h using a XRW-300H apparatus model (product of
Chengde Xinma Testing Instrument Co., Ltd.). The test specimen was a disc-like
sample with a diameter of 25.0 mm and a thickness of 2.0 mm. The VST was obtained from the
average value of at least 5 measurements.
Thermal
Conductivity Measurement. To characterize
the thermal conductivity of the samples, samples with the dimensions of
25.0 mm in diameter and 2 mm in thickness were measured by using a
thermometer (model: TCI, C-THERM Inc., Canada) in an air-conditioned room
(25 oC). All of the thermal measurements were performed three
times and the averages were taken to calculate the thermal conductivity.
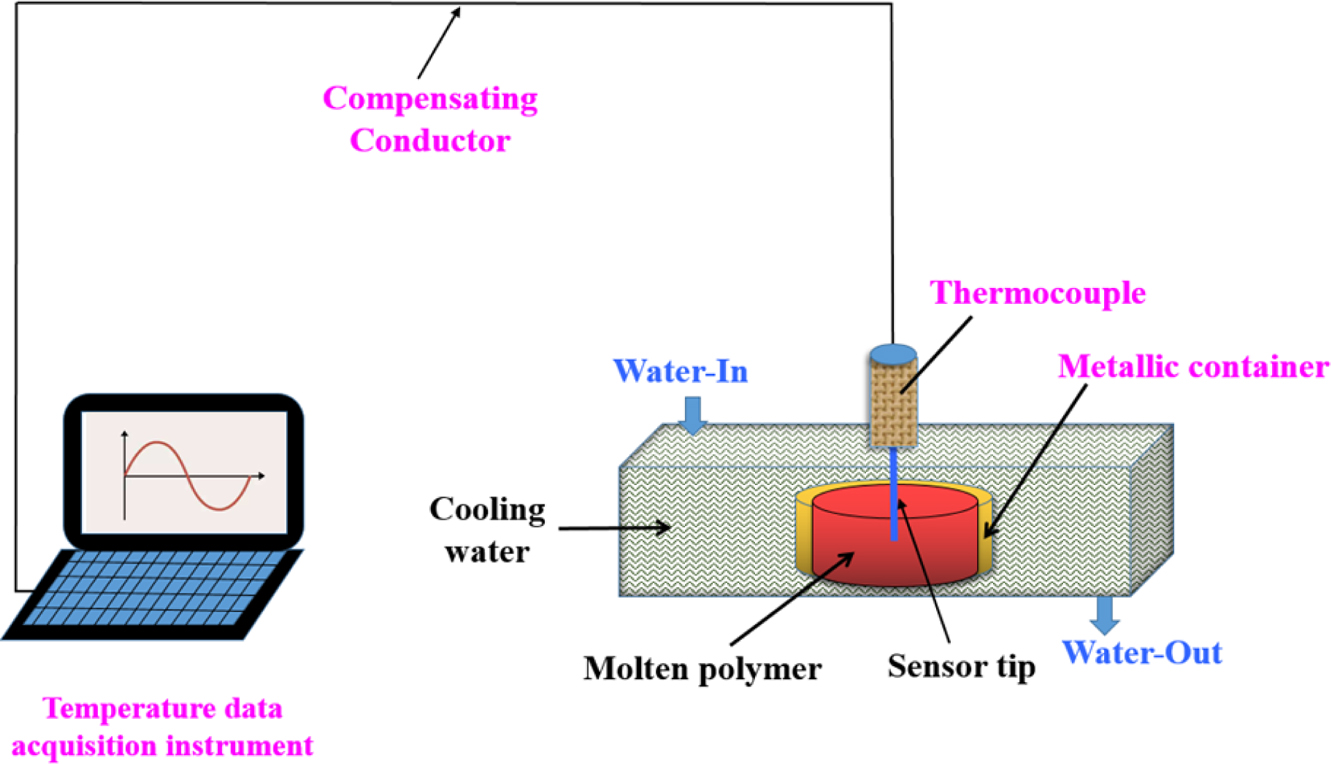
In-situ Temperature Measurement. In this study, an
Automatic Data Acquisition System (model: LU-R2100, Anthone Electronics Inc.,
China) was used to record the sample from the molten state to the cooling and
solidification process in real time. The sample (ca. 4-6 g) was placed in
a cylindrical metal container having a diameter of 8 mm and a height of
10 mm. The container was heated to 270 C using an electrical hot plate
(model: YOUYUE-946A, Youyue Seiko Inc., China), then held for 15 min to ensure
that the sample was fully melted. A 0.5 mm diameter sensor (model: TK-247,
measuring rang: 0~350 ºC, Anthone Electronics Co., China) was inserted
into the middle of the molten sample to quickly place the sensor-attached sample
into 20 oC of circulating water until cooling solidified, the
temperature corresponding to the time is displayed in the computer. The
schematic of experimental set-up is illustrated in Figure 1.
|
Figure 1 Schematic of experimental device for in-situ temperature measurement. |
Dynamic
Rheological Properties. Rheological
characterizations are a known effective method for assessing the fluidity of
material processing.32 Usually neat polymers display pseudoplastic
behavior which is characteristic of an initial constant shear viscosity at
low-frequency zone, and a decrease in shear viscosity with increasing
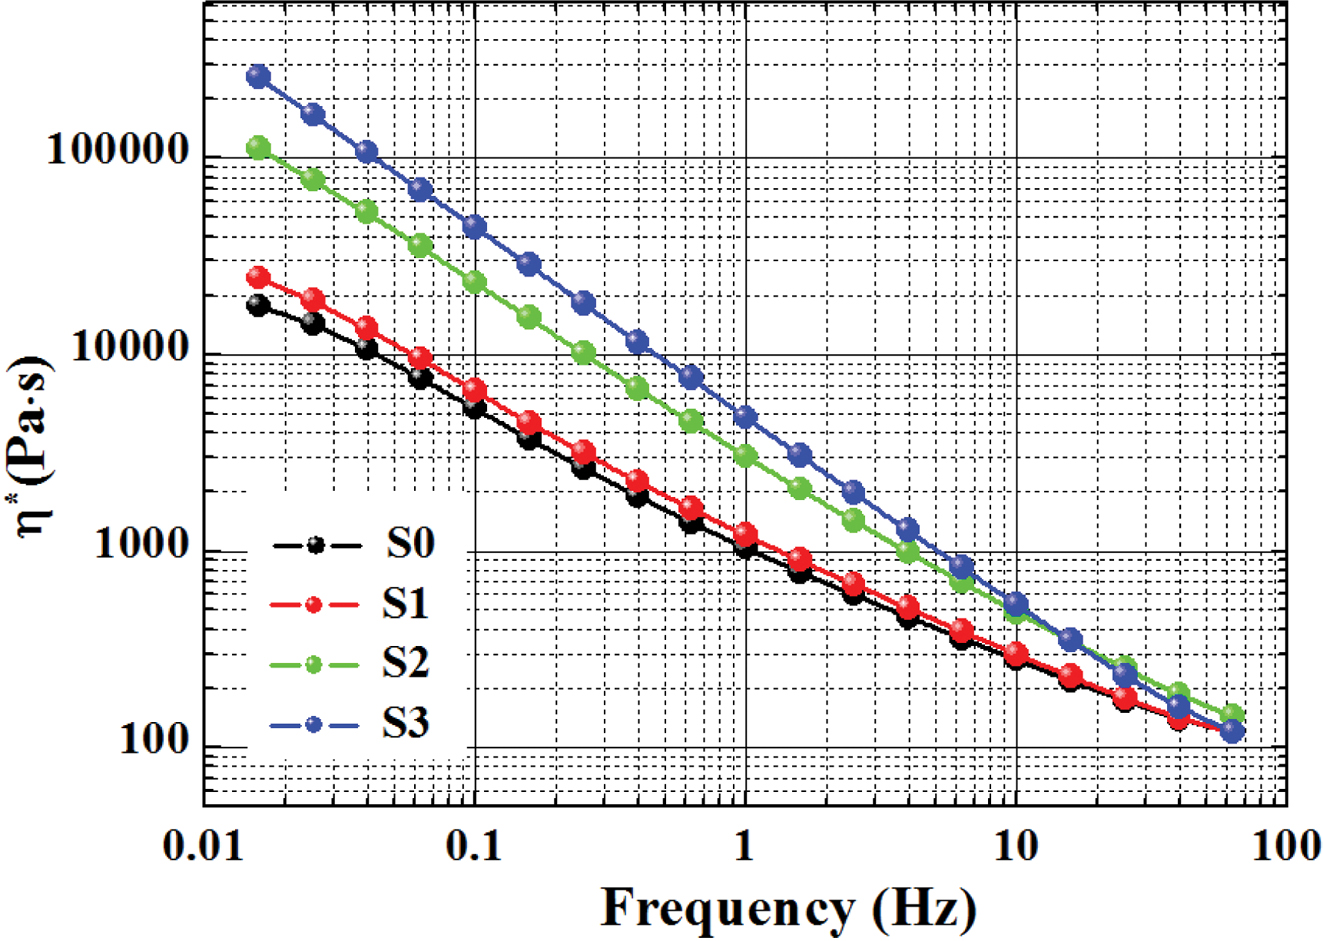
frequency.33 Figure 2 shows the frequency dependence of the complex
viscosity (h*) of all samples
measured at 285 oC. With the increase of frequency, the melt
viscosity decreased, and all samples displayed the shear-thinning behavior,
obeying the characteristics of the pseudoplastic fluid.
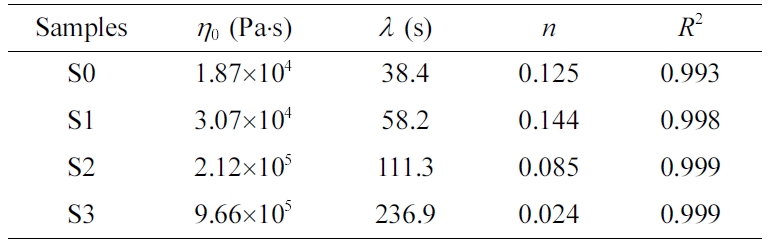
The Carreau-A model can be adopted in this work to non-linearly
fit the rheological data of the samples:34
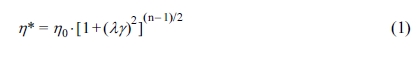
where h* is the complex
viscosity, h0 the zero-shear
viscosity, g the shear rate,
and l the characteristic
relaxation time. Here, n is the non-Newtonian exponent. Using the
nonlinear fitting, all parameters was obtained and listed in Table 1. The characteristic
relaxation time (l) of the samples
increased as the RPET loading increased, meaning that the disentanglement of
molecular chains became more serious due to the addition of more PET
macromolecular chains, whose trend is in agreement with the variation of
zero-shear viscosity (h0) as demonstrated
in Table 1.
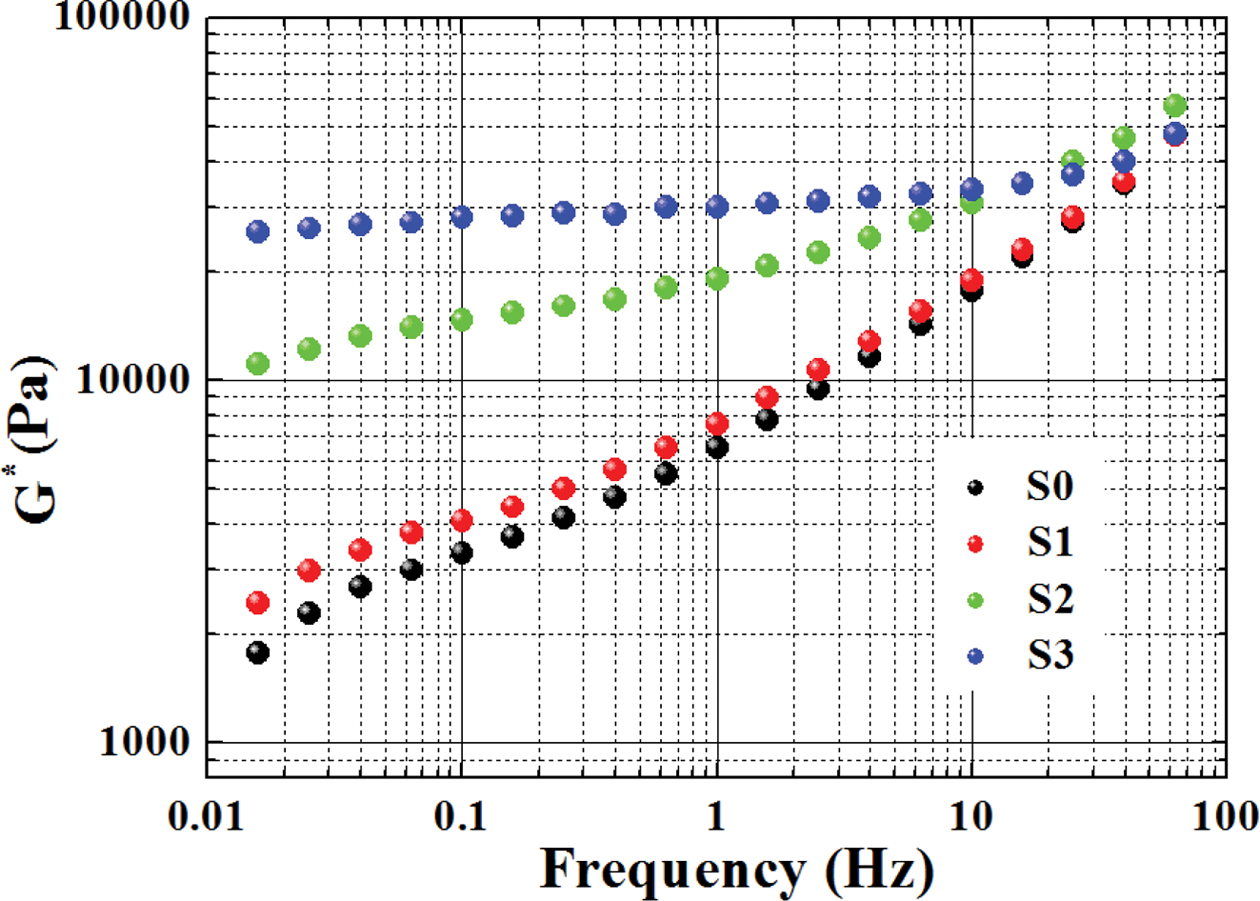
Figure 3 shows that the values of complex modulus (G*) of the
samples increased with increasing frequency. As the increase of RPET content,
the G* increased considerably, especially at the low frequency region (e.g.,
from 0.01 to 1 Hz), considering that G* of PET is higher than that
of PE. The G* of the samples in the high frequency region jumped
significantly with increasing frequency, which may be due to the limitation of
the material’s resilience after elastic deformation within high frequency
region. Their G* showed a trend of convergence at high frequencies,
suggesting that the dependence of G* on frequency became weaker in high
frequency zone.
Non-isothermal
Crystallization Kinetics. The non-isothermal
crystallization behaviors of various samples were examined using DSC
characterization. DSC, as a multi-purpose, efficient, fast, and sensitive
analytical testing method, has been widely used to study both physical changes
(e.g., melting, crystallization, and crystal form transformation, etc.)
and chemical changes (e.g., decomposition, degradation, polymerization,
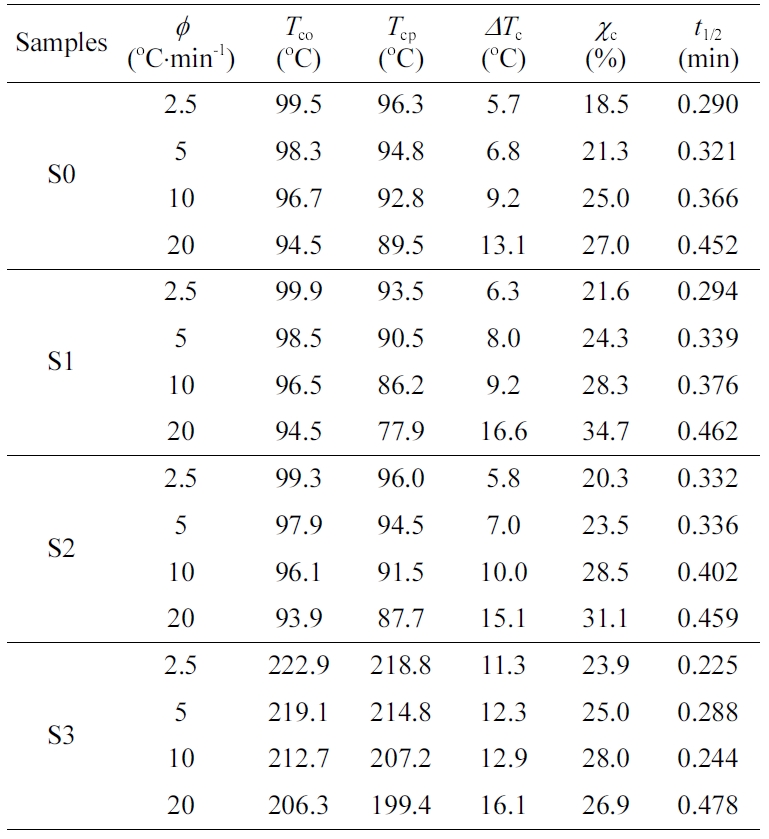
crosslinking, redox, etc.) of the substances. The absolute crystallinity
(cc) developed during the cooling stage can be
estimated using the following expression:35
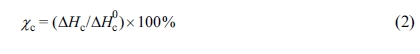
where DHc is the enthalpy of
melt crystallization, and DH0c is the crystallization
enthalpy of fully-crystallized PE in the cooling scans, which was taken as 288
J/g and the PET was 166 J/g.36,37 Table 2 presented
the DSC detailed crystallization parameters at various cooling rates for
various samples. With increasing cooling rate, the crystalline peak moved
towards the lower temperature side, suggesting a strong supercooling was
required to crystallize the melt.38 Besides, the crystallization
temperature curves in Table 2 all became broader with increasing cooling rate,
considering the fact that imperfect polymer crystals were normally formed under
rapid crystallization or at high cooling rates (cf. DTc). 39 Interestingly, there is only a
crystalline peak of PE in the S1 and S2 blends, while RPET has no crystalline
peak. Mainly due to the slow crystalline nature of PET, and PE macromolecular
chains can be inserted into the PET chain, reducing the crystallization ability
of PET. With increasing RPET content, the crystallinity of PE in the blends (i.e.,
S1 and S2) displayed an increase trend in comparison to PE (S0), which
indicated that the existence of RPET (in solid state during the whole
crystallization temperature zone of PE) acted as nucleating agent in the blends
during melt crystallization of PE.
The relative crystallinity (Xt) at time t can be
expressed as a function of crystallization temperature by eq. (3):40
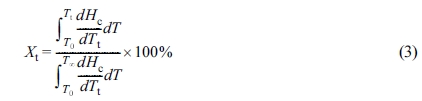
where Tt is the crystallization temperature at
crystallization time t and T0 and T∞
are the onset and end crystallization temperatures, respectively. dHc
denotes the crystallization enthalpy released during an infinitesimal temperature change
at temperature T.
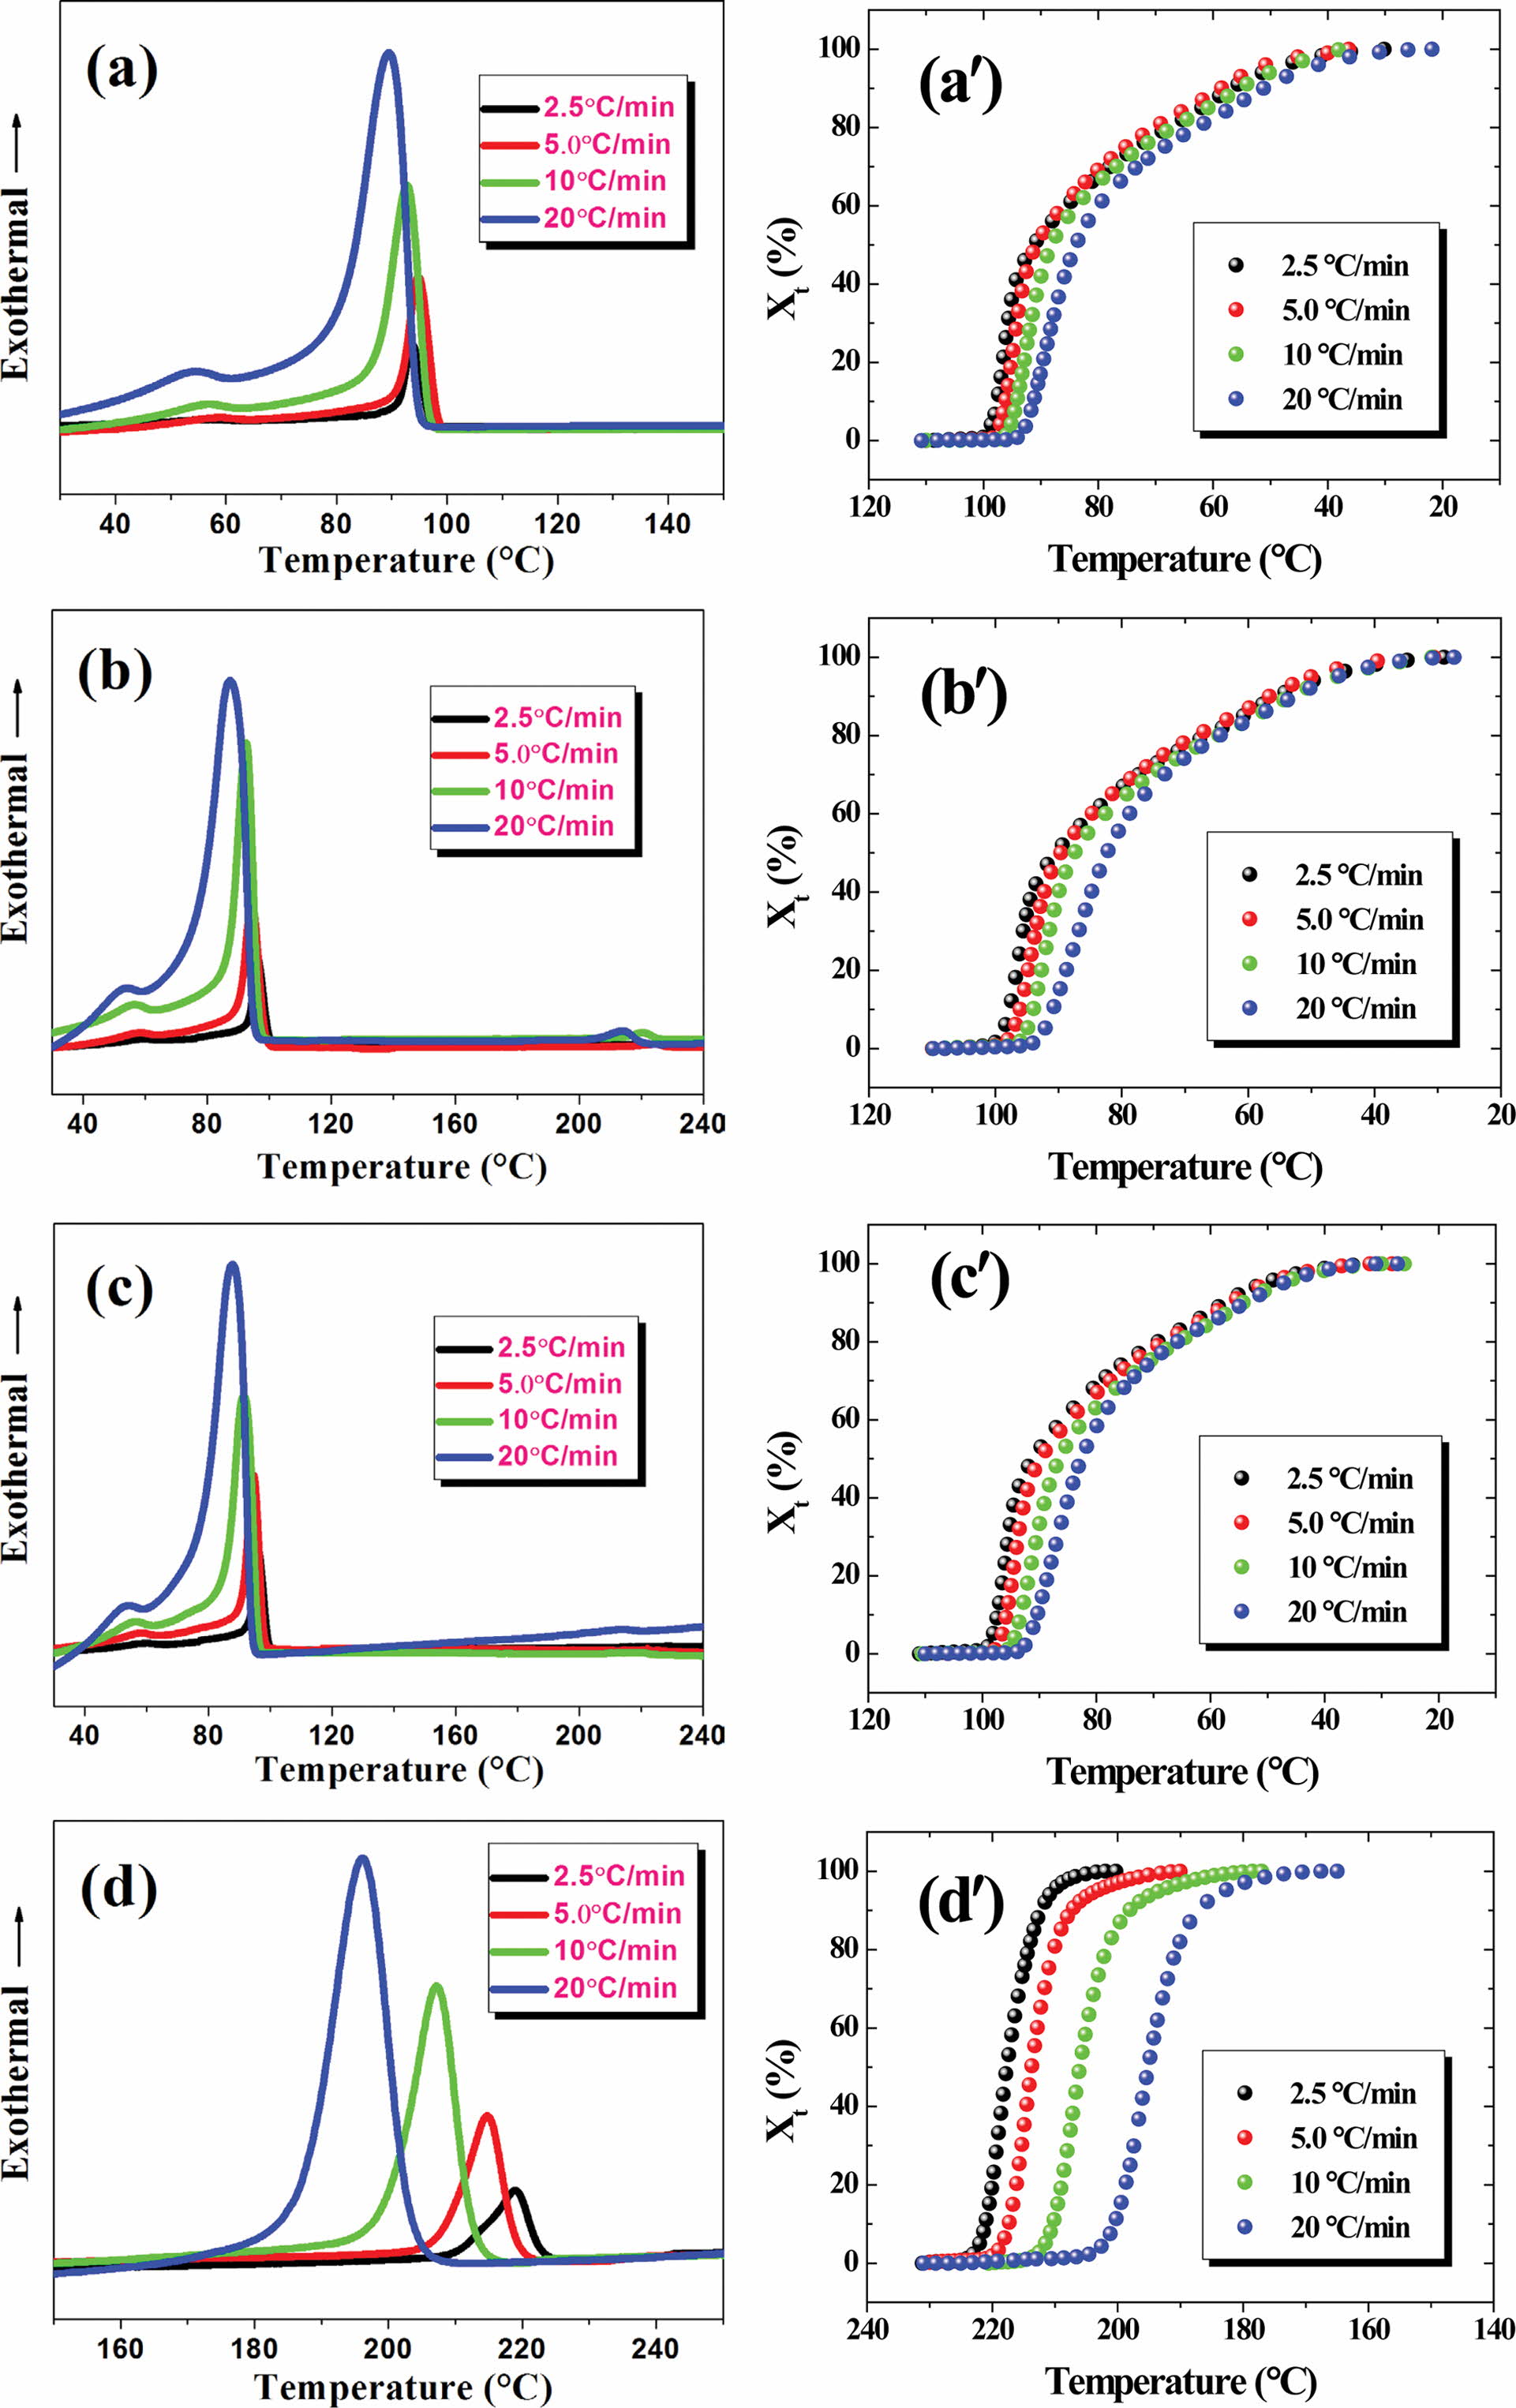
The molten samples were cooled for crystallization at given cooling
rates, during which exothermic phenomena occurred, with the heat flow curves
intuitively displaying the detailed thermal changes of the entire
crystallization process. Figure 4 shows the variation of heat flow and relative
crystallinity versus temperature for different samples measured at
various cooling rates. All crystallinity curves of the samples displayed an “S”-like
shape, including three stages of a polymer crystallization process.
Specifically, the Xt value showed a significant increase
after a short induction period, after which Xt gradually
reached its maximum during the third crystallization. The crystallization half
time (t1/2), the time required for the polymer to reach 50%
crystallinity, is an important parameter for characterizing the polymer
crystallization rate. According to the results of the crystallization half time
(t1/2) which is an evaluation of the overall crystallization
rate, the t1/2 of a given sample increased with increasing
cooling rate, suggesting that a rapid drop in temperature will be hinder in
enhancing the crystallization rate. The addition of RPET promotes the
crystallinity of the material to an extent.
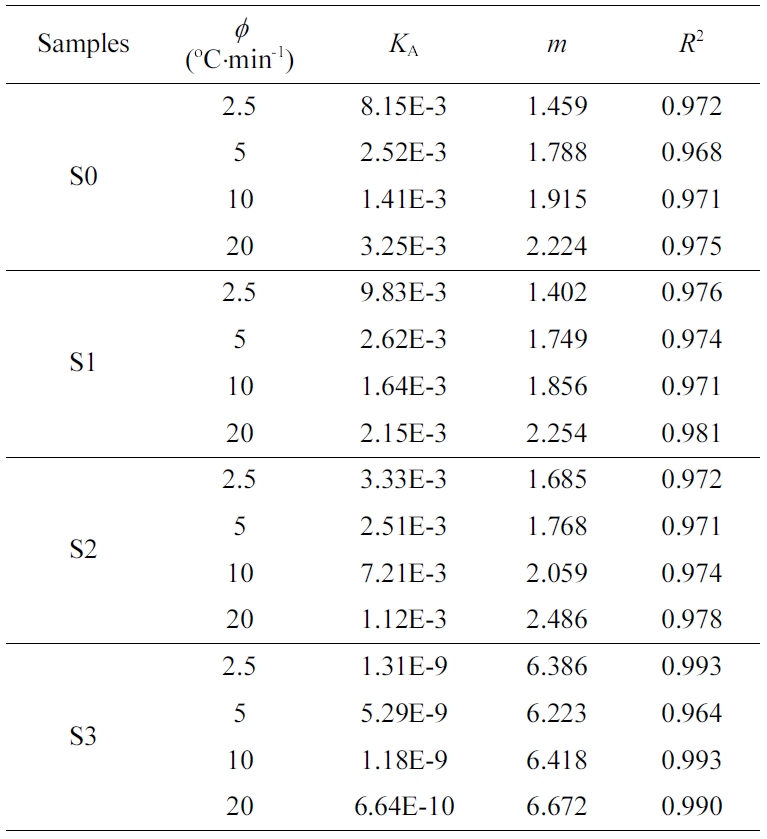
As is known, the isothermal crystallization kinetics of polymers were
well explained by the Avrami equation in the form Xt=1-exp(-KA×tm),
where Xt is a relative crystallization degree at the time t.
KA is a crystallization rate constant, and m is the Avrami
exponent which is a mechanism constant depending on the types of nucleation and
growth dimension.41,42 Table 3 presents the Avrami curve
fitting parameters of the Xt versus crystallization
time. In Table 3, the Avrami exponent m values of S0, S1 and S2
were 1.459~2.224, 1.402~2.254 and 1.685~ 2.486, respectively, indicating that
the crystallization could be contributed by both one-dimensional crystal growth
mechanisms coupled with a heterogeneous nucleation at low cooling rates (cf.
2.5 and 5 oC/min), and the crystallization of the blends
occurred in two-dimensional mechanism at high cooling rates (cf. 10 and
20 oC/min). The increase in n value suggested the mode
of spherulitic nucleation and the growth became more complex.
Dynamic
Mechanical Thermal Analysis (DMTA) and Vicat Softening
Temperature (VST) Measurement. One of the most
powerful tools to investigate the viscoelastic properties of polymeric
materials is dynamic mechanical thermal analysis (DMTA), which applies a very
small sinusoidal strain to the sample at a constant frequency with an
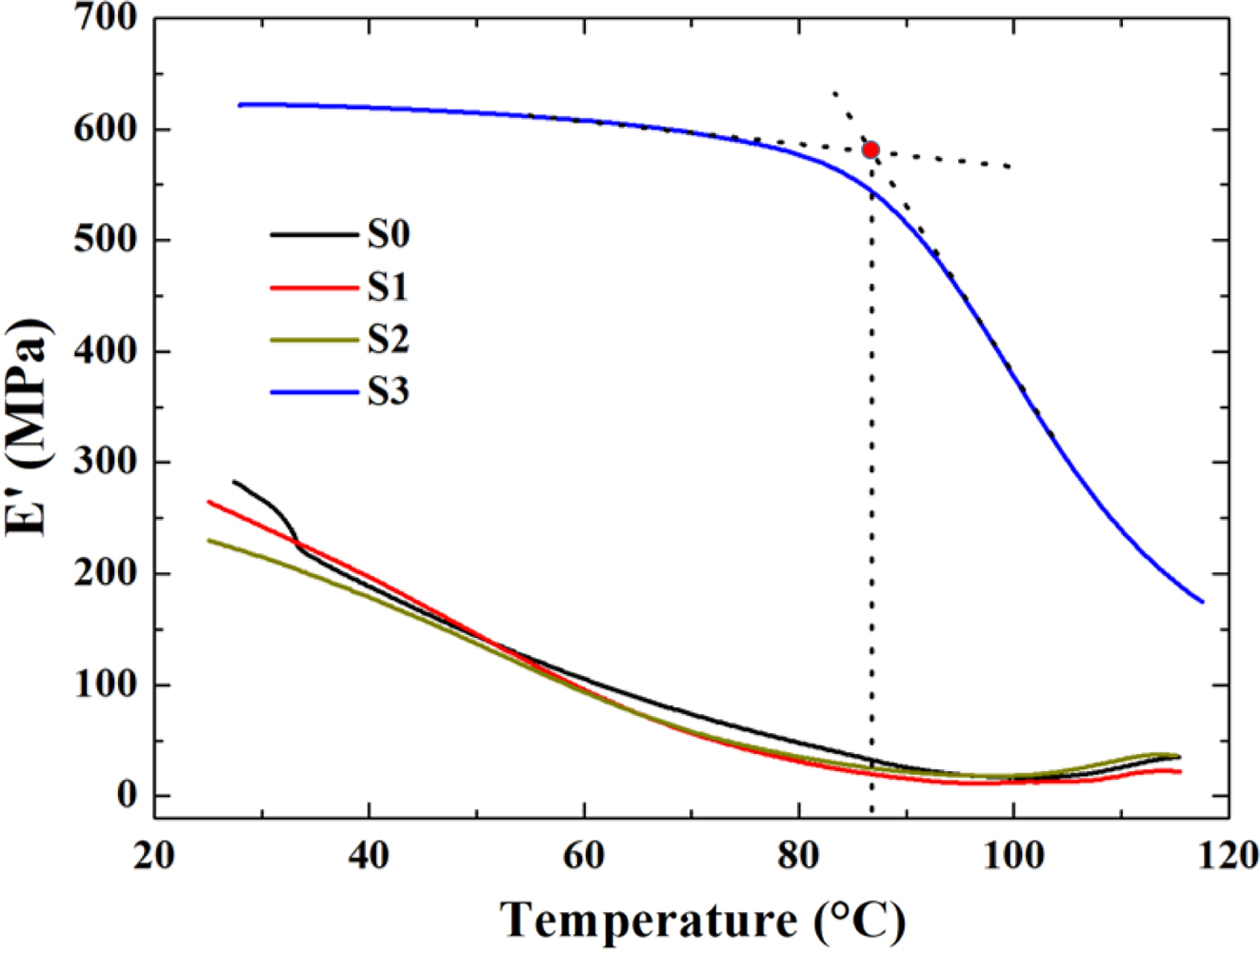
increasing temperature at constant rate.43 Figure 5 presents the
variation of storage modulus (E') as a function of testing temperature (T),
respectively. The storage modulus refers to the ability of a material to store
energy, which is a measure of material’s stiffness.44 In Figure 5, a
severe drop of E' along the viscoelastic zone was observed until the
temperature got close to 85 oC, which could be associated to
the mobility of amorphous region of the material.43,45 As is well
known, the “rubbery plateau” in the storage modulus curves represents the
degree of interaction between polymerics system.46 The sequence of E'
value was as follows: E'S3>E'S0>E'S1>E'S2.
In spite of the fact that RPET had high storage modulus, the E' of the
blend hardly increased with the addition of RPET indicating that the PE/RPET
presents a lower degree of interfacial interaction.46,47
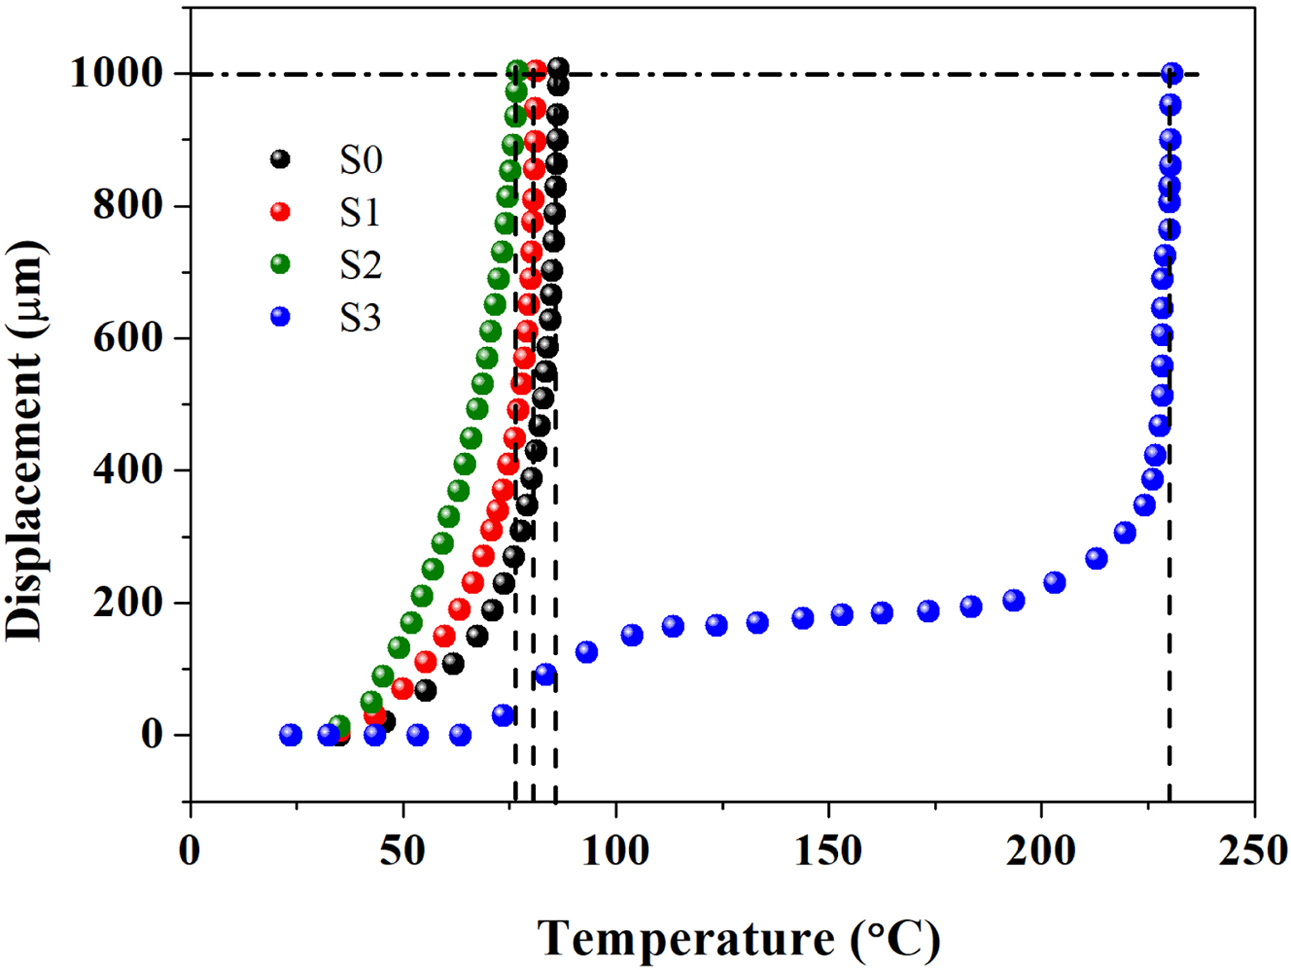
VST is an important parameter for the evaluation of thermal resistance of
thermoplastic materials when subject to heating.48-50 The higher the VST
value, the better the dimensional stability of the material upon heating, which
also means, the smaller the thermal deformation, the greater the rigidity as
well as the higher the modulus. According to Figure 6, the sequence of VST was
as follows: VSTS3> VSTS0> VSTS1> VSTS2
(the VST values of S0, S1, S2 and S3 were 86.6, 81.3, 80.4 oC
and 230.4 oC, respectively), indicating that S3 material has
better dimensional stability when heated, and has less thermal deformation,
which is well consistent with the trend of E'.
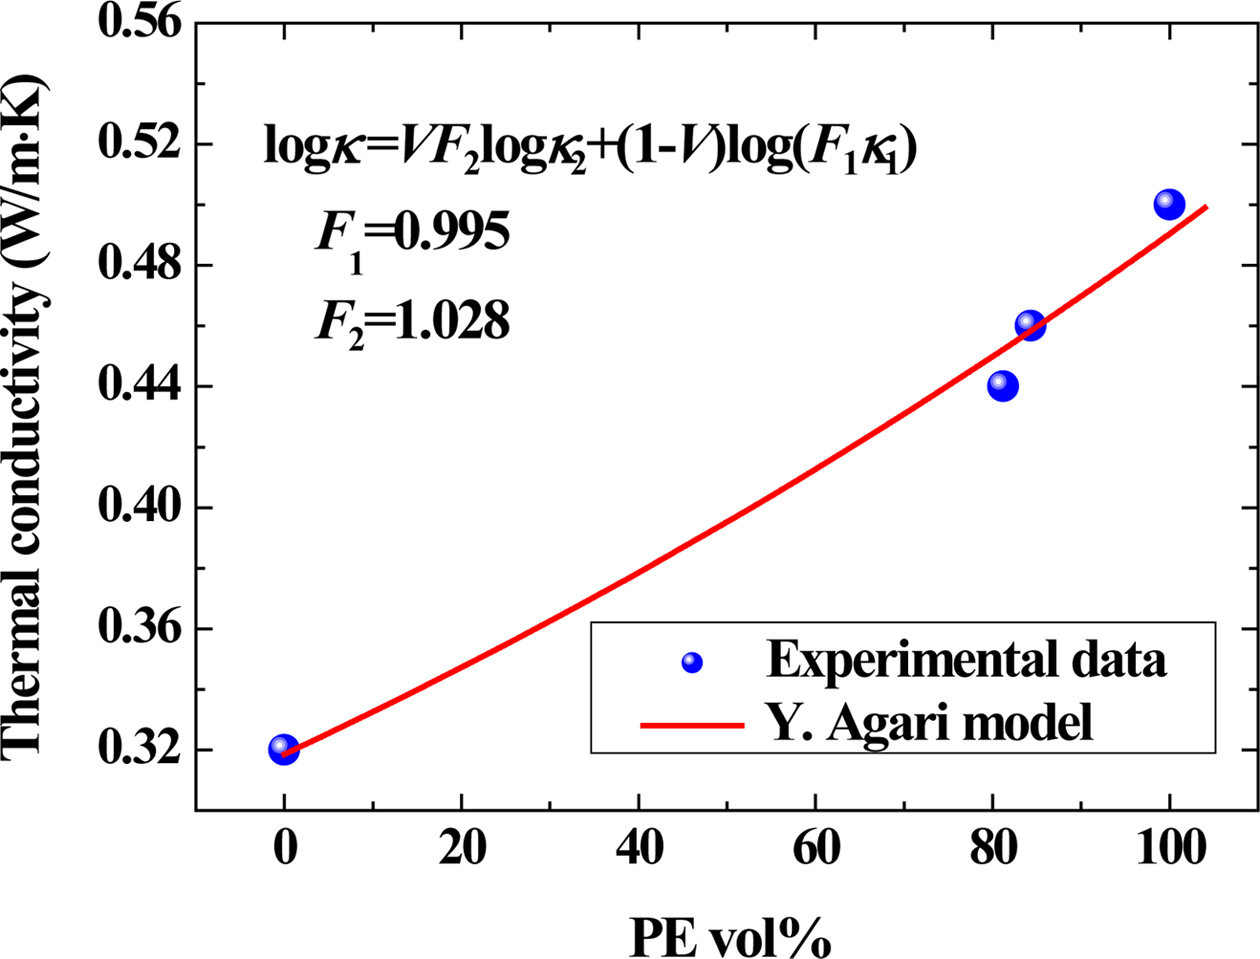
Thermal
Conductive Property. Figure 7 showed
the influence of PE loading on the thermal conductivity of the samples.
According to the viscosity ratio, in the PE/PET blend, since the PET content is
lower than PE, the PET is dispersed as a spherical particle in the matrix of
the PE, that is, “sea-island structure”.51,52 According to our
previous research, the Agari model showed relatively good applicability
in polymer composites, which clearly revealed formation of the thermal network
structure.53 The Agari equation can be written as follows:54
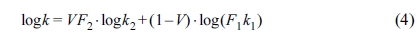
In eq. (4), k1, k2 and k are
the thermal conductivities of RPET, PE and their blends, respectively (k1=0.319 W/m·K,
k2=0.498 W/m·K in this work). V is the volume
content of PE here. In the Agari model, F1 is usually
a factor relating to the crystallinity and crystal size of polymer. Parameter F2
varies with the dispersion state of filler (a typical range within -2~2) and is
related to the ease in forming the thermal conductive chains in the matrix.53,54
The larger the F2 value, the easier the formation of the
thermal conductive chains (characteristic of a higher thermal conductivity).
According to the calculations, F2 is 1.028 in this study,
indicating that it is easy for PE to form a thermal conductive structure in
blends.
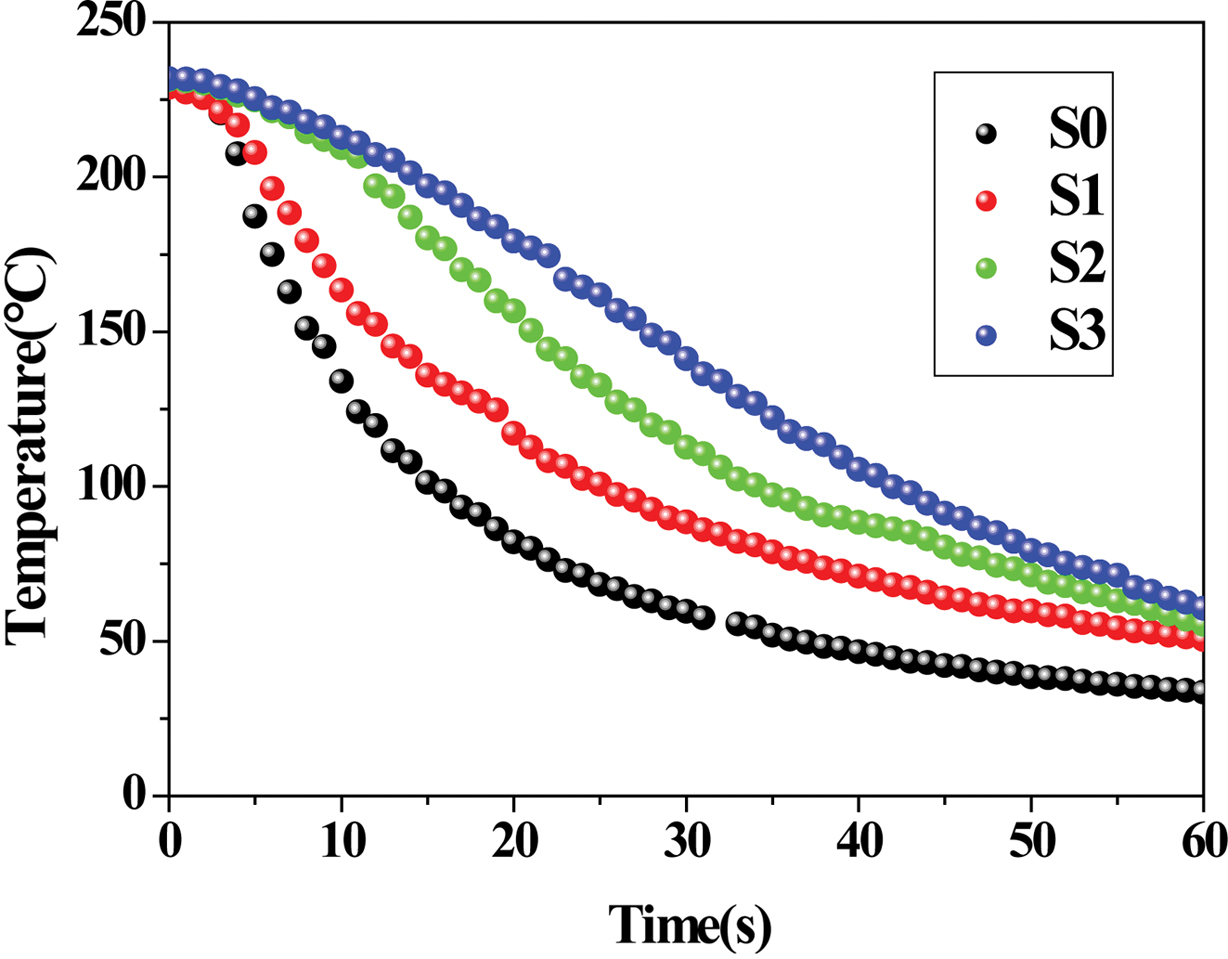
In-situ Melt Solidification Behavior and
Application in Cooling Time Prediction. Figure 8
demonstrated the temperature decay curves of PE, RPET and their blends, which
were obtained using an in-situ temperature measurement technique.
A cooling process of crystalline polymers basically undergoes three steps: the
temperature of the melt decreases rapidly from an initial temperature to the
phase-change temperature; secondly, the crystallization (accompanied with a
phase change from liquid to solid simultaneously) occurs and results in a
slow-down in the cooling rate; finally, the cooling curves gradually become
flat till the temperature gets close to the cooling medium’s temperature.
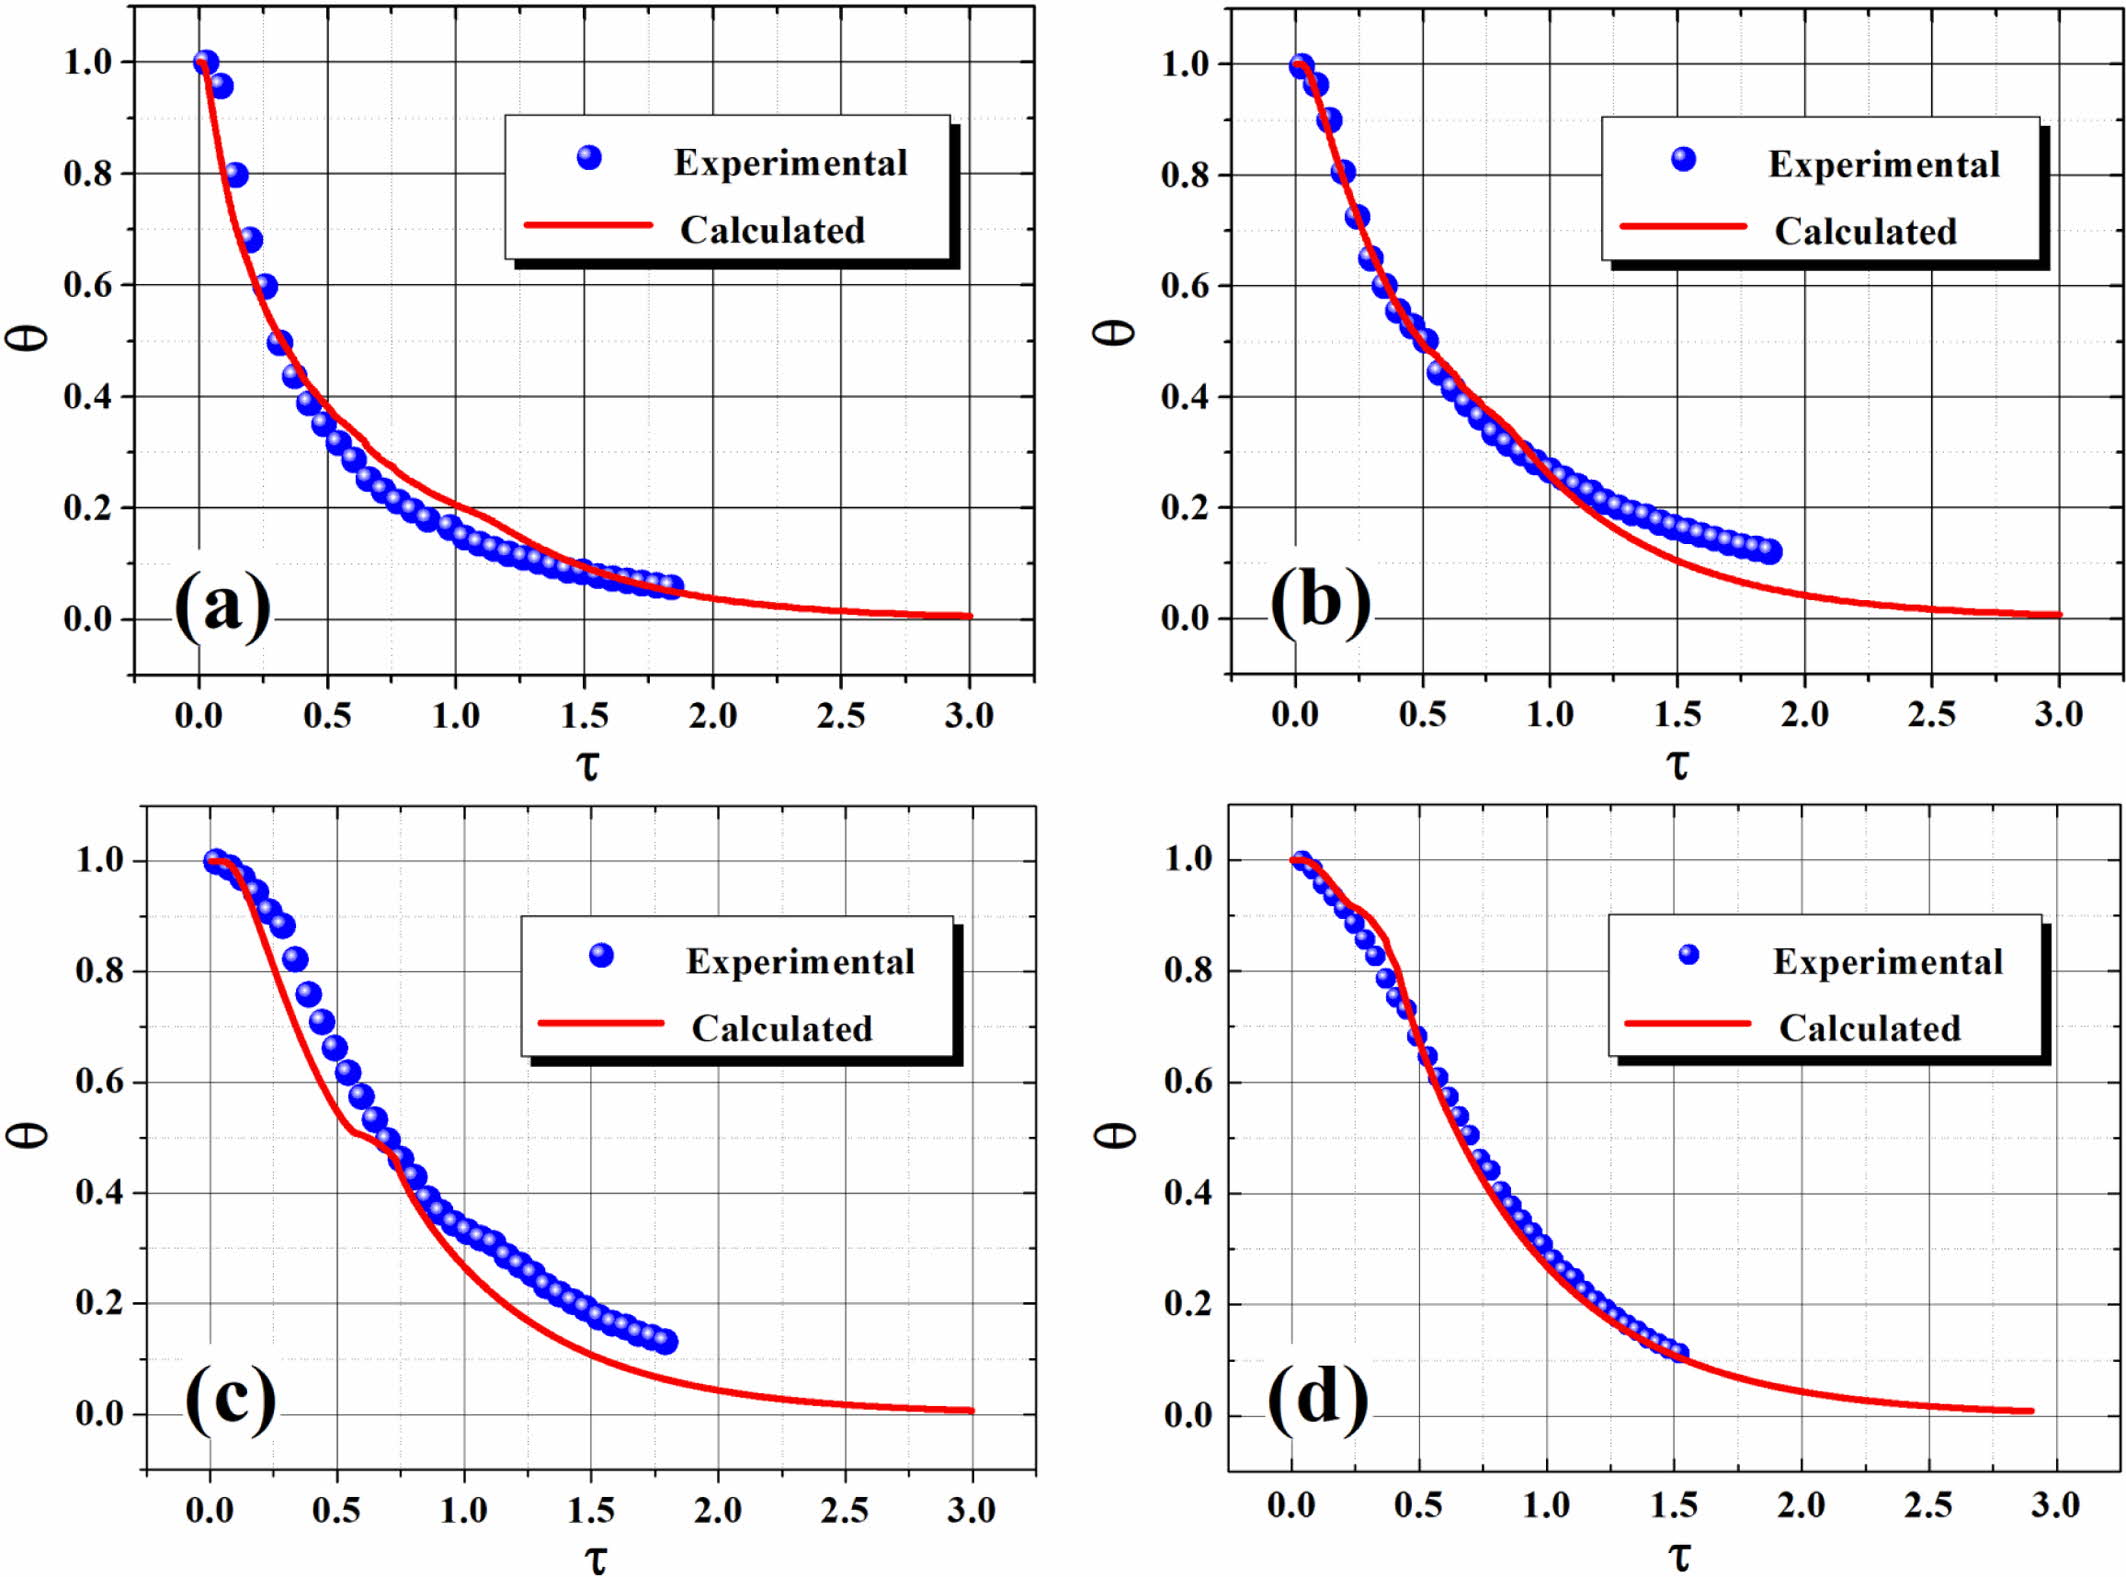
The enthalpy transformation method (ETM),55 which was raised
previously for analyzing the phase-change behavior of crystalline polymers,27-31
was adopted in this work. The experimental cooling data were compared with the
predicted cooling curves using ETM (as demonstrated in Figure 9), with two
dimensionless parameters (q and t) defined as follows:56,57
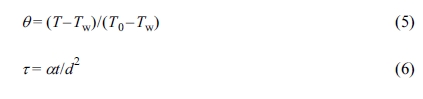
where T, T0 and Tw are the
time-dependent melt temperature, initial melt temperature, and cooling medium
temperature, respectively; q and t are normalized temperature and dimensionless time,
respectively; α is the thermal diffusivity which is defined by α=k/(r×Cp)
with d denotes half the thickness of the molten polymer layer; k
is the thermal conductivity; r is the density; and
Cp is the heat capacity at constant pressure. The
dimensionless time (τ), also known as the Fourier number, is a
good measure of the rate of heat conduction in comparison with the rate of heat
storage in a given volume element, and a small value of τ usually means
rapid polymer kinetics as compared with the heat diffusion process.58
Obviously, an agreement can reasonably be achieved from the comparison
(cf. Figure 9). Overall, ETM presents relatively better prediction for neat
polymer in comparison to the blends (S1 and S2), especially during the later portion
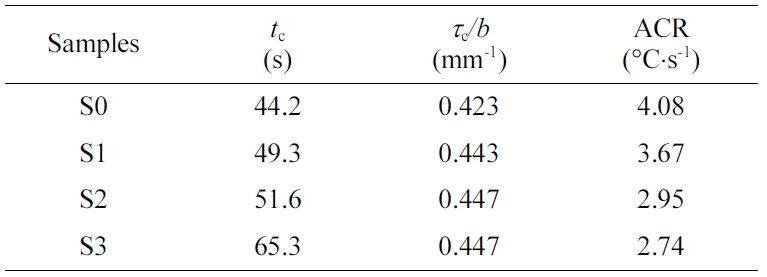
of the cooling process. The cooling time (tc) and average
cooling rate (ACR) of the polymer melt can readily be evaluated, with the
cooling data summarized in Table 4. As the PET content increases, the tc
value also increases (accompanied by a decreased ACR), considering the thermal
conductivity of PET is lower than that of PE. Interestingly, the value of tc/d is found to nearly remain constant (ca.
0.44) regardless of the material’s compositions, which can be fairly useful in
forecasting the minimum cooling times (tcm) for PE, PET and
their blends in the plots of q vs. t during industrial processing operations (e.g.,
injection molding, compression molding, etc.) when the thickness of the
molded part is known. For instance, the calculated tc value
of S3 is 65.2 s in comparison to an experimental value of 68.2 s in the present
work.
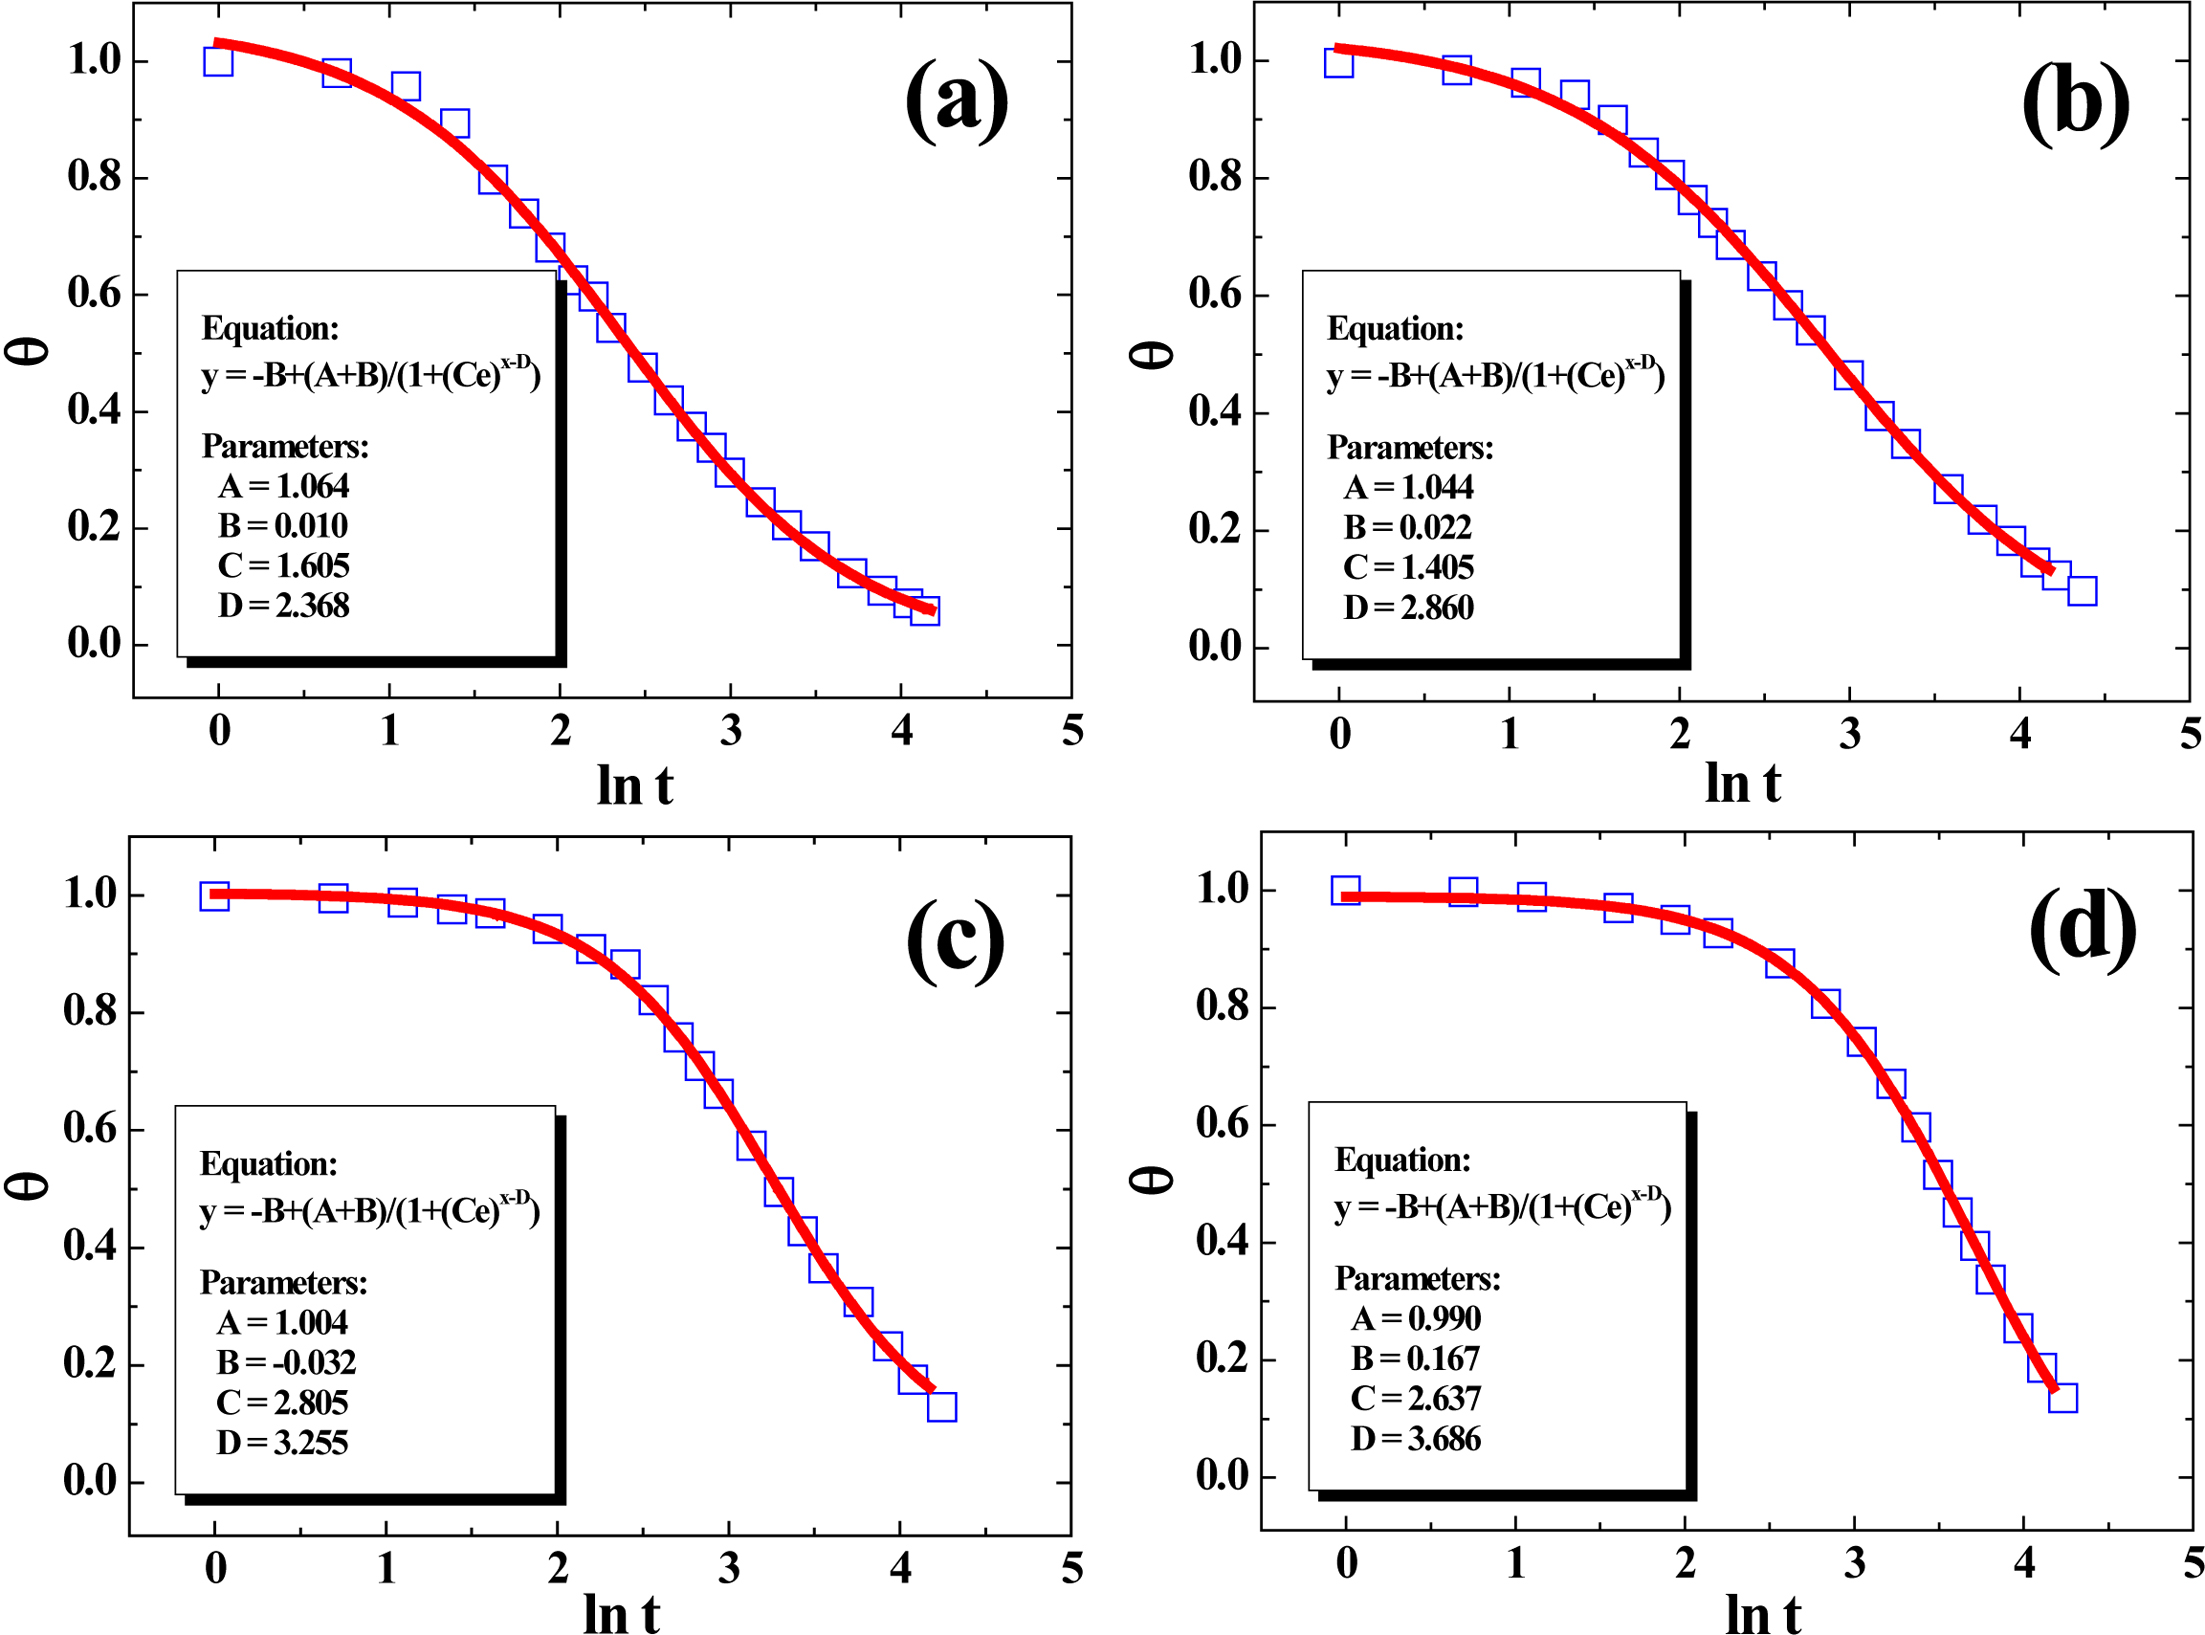
In our previous research, the four-parameter model (FPM) can already be
used very reliably to non-linearly fit the cooling curves of various
crystalline polymers (PP, PE, PVDF, etc.),59,60 which can be
written as follows:
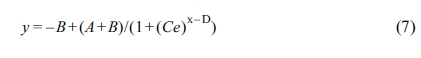
where y = θ and x = ln t,
respectively. The meanings of the parameters A, B, C and D
here are as follows: A is a parameter that is primarily determined by T0,
which is quite close to 1. B is dictated by Tw, which
is close to 0. Parameter C is defined as a position-dependent
coefficient of FPM; and parameter D, reflecting the time required for
the temperature of polymer to fall from T0 to the
phase-change temperature range, is heavily influenced by the molecular
structures of material and a smaller value of D always indicates a
higher cooling rate.59 Figure 10 presented the plots of q versus ln t for the samples with cooling
data fitted by FPM. It was obvious that FPM showed perfect fitting effect based
upon the values of the regression coefficients R2, suggesting
FPM can be applicable in the analysis of solidification kinetics for the
PE/RPET blends. From the values of parameter D, it is obvious that D
decreased with the increase of PE%, suggesting that it’s easier for PE to form
a thermal conductive structure in blends at higher loading, which is in good
agreement with our earlier discussion.
|
Figure 2 Complex viscosity of various samples versus frequency. |
|
Figure 3 Complex modulus of various samples versus frequency. |
|
Figure 4 DSC exothermal curves of various samples measured at different cooling rates (a-d); the temperature dependence of relative crystallinity for various samples at different cooling rates (a'-d'). |
|
Figure 5 DMA curves of various samples. |
|
Figure 6 Curves of vicat temperature measurement. |
|
Figure 7 Correlation between thermal conductivity and PE loading as well as the fitting curve using Agari model. |
|
Figure 8 Temperature decay curves of various samples. |
|
Figure 9 Plots of dimensionless temperature versus elapsed time. |
|
Figure 10 Plots of experimental cooling data fitted using FPM, with all curves’ regression coefficients (R2) above 0.999. |
In this work, melt extrusion was used to prepare series of polyethylene
(PE)/recycled polyethylene terephthalate (RPET) blends in an attempt to explore
the effect of RPET loading on both crystallization and thermal conductive
behaviors of the blends. Our findings indicate that RPET exists in an
amorphous state and can act as a nucleating agent for PE without changing its
crystalline form in the blend. The classical thermal conduction model by Agari
was adopted and could present a rather reasonable prediction about the
relationship between thermal conductivity and PE loading for the blends. In the
study of solidification kinetic, a four-parameter model (FPM) was utilized
jointly with in-situ temperature measurement data. In addition, cooling
time (tc) was also estimated by using an enthalpy
transformation method (ETM), which had widely been reported in research on the
kinetics of phase transitions analysis of crystalline polymers (HDPE, PP, PLA, etc),27-31
and the theoretical cooling times were in consistence with the experimental
data. The present work will be practically significant for further research on
the “processing-structure-property” relationship of polymer blends as well as
the extension of the application fields for RPET.
- 1. S. Yildirim, K. Pehlivan, A. Durmus, and K. Esmer, Polym. Korea, 42, 769 (2018).
-

- 2. Y. Ahn, J. H. Jeon, J. H. Park, T. Thenepalli, J. W. Ahn, and C. Han, Korean J. Chem. Eng., 33, 3258 (2016).
-
- 3. K. Kim, D. Jung, J. Han, and J. Kim, Polym. Korea, 42, 8 (2018).
-
- 4. H. Kim, Y. Yang, K. Hwang, and K. Ha, Polym. Korea, 41, 1011 (2017).
-
- 5. S. C. Li and L. N. Lu, J. Appl. Polym. Sci., 108, 3559 (2008).
-
- 6. Y. S. Choi and H. Y. Jeon, Polym. Korea, 39, 475 (2015).
-
- 7. Y. J. Kwak, J. H. Seo, and S. W. Lee, Polym. Korea, 42, 456 (2018).
-
- 8. A. Tasic, J. D. Rusmirovic, J. Nikolic, A. Bozic, V. Pavlovic, A. D. Marinkovic, and P. S. Uskokovic, J. Compos. Mater., 51, 491 (2016).
-
- 9. S. Lee, S. Kang, and J. H. Kim, Polym. Korea, 41, 287 (2017).
-
- 10. W. J. Yang and J. H. Chang, Polym. Korea, 39, 746 (2015).
-
- 11. C. Fang, R. Yang, Z. S. Zhang, X. Zhou, W. Q. Lei, Y. L. Cheng, W. Zhang, and D. Wang, RSC Adv., 8, 8920 (2018).
-
- 12. S. Choi and Y. Jeong, Polym. Korea, 38, 240 (2014).
-
- 13. N. S. Allen, M. Edge, M. Mohammadian, and K. Jones, Polym. Degrad. Stabil., 43, 229 (1994).
-
- 14. R. Sharma and P. P. Bansal, J. Clean. Prod., 112, 473 (2016).
-
- 15. H. P. Blom, J. W. The, and A. Rudin, J. Appl. Polym. Sci., 70, 2081 (2015).
-
- 16. M. Entezam, M. K. R. Aghjeh, and M. Ghaffari, Radiat. Phys. Chem., 131, 22 (2017).
-
- 17. M. M. Lubna, K. S. Salem, M. Sarker, and M. A. Khan, J. Polym. Environ., 26, 83 (2018).
-
- 18. Z. Kordjazi and N. G. Ebrahimi, J. Appl. Polym. Sci., 116, 441 (2010).
-
- 19. R. J. Shields, D. Bhattacharyya, and S. Fakirov, J. Mater. Sci., 43, 6758 (2008).
-
- 20. R. S. Chen, S. Ahmad, and S. Gan, Compos. Part B-Eng., 131, 91 (2017).
-
- 21. Y. W. Park, M. Park, H. Y. Kim, H. C. Kim, J. C. Lim, F. L. Jin, and S. J. Park, Bull. Mater. Sci., 41, 104 (2018).
-
- 22. P. Raffa, M. Coltelli, and V. Castelvetro, J. Appl. Polym. Sci., 131, 5829 (2014).
-
- 23. R. S. Chen, S. Ahmad, and S. Gan, Polym. Compos., 39, 2695 (2018).
-
- 24. N. R. N. Hassan, N. M. Ismail, S. Ghazali, and D. M. Nuruzzaman, IOP Conf. Ser.: Mater. Sci. Eng., 342, 012094 (2018).
-
- 25. S. Sombatdee, T. Amornsakchai, and S. Saikrasun, Polym. Advan. Technol., 29, 1123 (2018).
-
- 26. B. Yang, J. B. Miao, K. Min, R. Xia, J. S. Qian, and X. Wang, J. Appl. Polym. Sci., 128, 1922 (2013).
-
- 27. B. Yang, R. Xia, J. B. Miao, J. S. Qian, M. B. Yang, and P. Chen, Polym. Test., 32, 202 (2013).
-
- 28. B. Yang, M. Y. Ding, Y. Shi, L. Hu, R. Xia, J. B. Miao, M. Cao, J. S. Qian, P. Chen, Y. C. Zhang, and E. F. Fu, J. Appl. Polym. Sci., 136, 47390 (2018).
-
- 29. B. Yang, L. Hu, R. Xia, F. Chen, S. C. Zhao, Y. L. Deng, M. Cao, J. S. Qian, and P. Chen, Macromol. Res., 24, 74 (2016).
-
- 30. L. Hu, B. Yang, Y. L. Deng, F. X. Lu, R. Xia, Z. Z. Zheng, J. B. Miao, J. S. Qian, C. R. Zhang, P. Chen, and Y. C. Zhang, Polym. Korea, 41, 569 (2017).
-
- 31. H. B. Li, Q. Li, and M. L. Yan, Adv. Mater. Res., 291, 1820 (2011).
-
- 32. Y. Shi, B. Yang, J. B. Miao, Z. Z. Zheng, J. S. Qian, L. F. Su, M. Cao, R. Xia, P. Chen, J. W. Liu, and G. J. Li, Polym. Crystal., 2 (2019).
-
- 33. B. Zakani, M. Ansari, and D. Grecov, Rheol. Acta, 57, 83 (2018).
-
- 34. M. S. Chun and M. J. Ko, J. Korean. Phys. Soc., 61, 1108 (2012).
-
- 35. S. Nouri, C. Dubois, and P. G. Lafleur, Polymer, 67, 227 (2015).
-
- 36. M. B. Zarandi, H. A. Bioki, Z. A. Mirbagheri, F. Tabbakh, and G. Mirjalili, Appl. Radiat. Isotopes., 70, 1 (2012).
-
- 37. A. Granado, J. I. Eguiazábal, and J. Nazábal, Macromol. Mater. Eng., 289, 997 (2004).
-
- 38. J. N. Martins, O. Bianchi, C. H. Wanke, C. D. Castel, and R. V. B. Oliveira, J. Polym. Res., 22, 224 (2015).
-
- 39. C. I. Ferreira, C. D. Castel, M. A. S. Oviedo, and R. S. Mauler, Thermochim. Acta, 553, 40 (2013).
-
- 40. G. Z. Papageorgioua, D. S. Achiliasa, S. Nanakia, T. Beslikasb, and D. Bikiaris, Thermochim. Acta, 511, 129 (2010).
-
- 41. Y. P. Khanna, Polym. Eng. Sci., 30, 1615 (1990).
-
- 42. M. Avrami, J. Chem. Phys., 8, 212 (1940).
-
- 43. A. Elamri, A. Lallam, O. Harzallah, and L. Bencheikh, J. Mater. Sci., 42, 8271 (2007).
-
- 44. A. Vasiljevic-Shikaleska, F. Popovska-Pavlovska, S. Cimmino, D. Duraccio, and C. Silvestre, J. Appl. Polym. Sci., 118, 1320 (2010).
-
- 45. A. Kiziltas, D. J. Gardner, Y. Han, and H. S. Yang, J. Therm. Anal. Calorim., 103, 163 (2011).
-
- 46. Y. H. Zhang, J. R. Choi, and S. J. Park, Compos. Part A-Appl. S., 109, 498 (2018).
-
- 47. S. N. A. Safri, M. T. H. Sultan, M. Jawaid, and M. S. A. Majid, Compos. Struct., 226, 111308 (2019).
-
- 48. L. F. Miranda, L. H. Silveira, L. G. Andrade e Silva, and A. H. Munhoz, Jr., Adv. Sci. Technol., 71, 138 (2010).
-
- 49. Y. H. Liu, L. B. Bai, W. Q. Zhou, Y. W. Liu, M. Y. Tang, and K. L. Deng, Iran. Polym. J., 14, 891 (2005).
- 50. Zeus Industrial Products, Inc., Performance of High Temperature Plastics, Technical whitepaper, 1 (2005).
- 51. R. J. Shields, D. Bhattacharyya, and S. Fakirov, Compos. Part A-Appl. S., 39, 940 (2008).
-
- 52. Z. M. Li, W. Yang, B. H. Xie, R. Huang, M. B. Yang, and J. M. Feng, J. Macromol. Sci. B, 43, 519 (2004).
-
- 53. R. Xia, M. M. Sun, B. Yang, J. S. Qian, P. Chen, M. Cao, J. B. Miao, and L. F. Su, Polym. Korea, 42, 229 (2018).
-
- 54. Y. Agari, A. Ueda, and S. Nagai, J. Appl. Polym. Sci., 42, 1665 (1991).
-
- 55. B. Yang, Y. D. Guo, R. Xia, J. B. Miao, L. F. Su, J. S. Qian, P. Chen, and Q. L. Zhang, J. Macromol. Sci. B, 55, 99 (2016).
-
- 56. S. P. Liang, B. Yang, X. R. Fu, W. Yang, N. Sun, S. Hu, and M. B. Yang, J. Appl. Polym. Sci., 117, 729 (2010).
-
- 57. S. Q. Deng, B. Yang, J. B. Miao, R. Xia, J. S. Qian, P. Chen, and M. B. Yang, J. Polym. Eng., 32, 355 (2012).
-
- 58. B. Yang, X. R. Fu, W. Yang, L. Huang, M. B. Yang, and J. M. Feng, Polym. Eng. Sci., 48, 1707 (2008).
-
- 59. B. Yang, L. Hu, G. J. Li, C. R. Zhang, J. B. Miao, R. Xia, L. F. Su, Y. L. Deng, J. S. Qian, P. Chen, and Q. L. Zhang, Plast. Rubber. Compos., 46, 200 (2017).
-
- 60. B. Yang, M. Y. Ding, L. Hu, G. J. Li, J. B. Miao, X. Gao, X. B. Li, B. Zhang, L. F. Su, P. Chen, and J. S. Qian, J. Macromol. Sci. B, 58, 42 (2019).
-
- Polymer(Korea) 폴리머
- Frequency : Bimonthly(odd)
ISSN 0379-153X(Print)
ISSN 2234-8077(Online)
Abbr. Polym. Korea - 2023 Impact Factor : 0.4
- Indexed in SCIE
 This Article
-
2020; 44(3): 270-280
Published online May 25, 2020
- 10.7317/pk.2020.44.3.270
- Received on Dec 9, 2019
- Revised on Mar 4, 2020
- Accepted on Mar 16, 2020
Services
- Full Text PDF
- Abstract
- ToC
- Acknowledgements
Introduction
Experimental
Results and Discussion
Conclusions
- References
Shared
Correspondence to
- Bin Yang
-
College of Chemistry & Chemical Engineering, Institute of High Performance Rubber Materials & Products, and Key Laboratory of Environment-Friendly Polymeric Materials of Anhui Province, Anhui University, Hefei 230601, China
- E-mail: yanbin@ahu.edu.cn
- ORCID:
0000-0001-7578-4389
Hyecheon Building(Room 601), #354, Gangnam-Daero, Gangnam-Gu, Seoul 06242, Korea
TEL : 82-2-568-3860, 561-5203, 569-3860 FAX : 82-2553-6938 E-mail: polymer@polymer.or.kr