


- Effect of Contact Pressure on Reciprocating Wear Behavior of PEEK, PTFE, and UHMWPE
Liu Lian, Duan Haitao†
 , Jia Dan, Tu Jiesong, Zhan Shengpeng, Li Yinhua,
Luo Xiaoshuang, Zhan Wen, Xiong Wei, and Li Jian†
, Jia Dan, Tu Jiesong, Zhan Shengpeng, Li Yinhua,
Luo Xiaoshuang, Zhan Wen, Xiong Wei, and Li Jian† State Key Laboratory of Special Surface Protection Materials and Application Technology, Wuhan Research Institute of Materials Protection, Wuhan 430030, Hubei, China
- 접촉 압력이 PEEK, PTFE 및 UHMWPE의 왕복 마모 거동에 미치는 영향
Engineering plastics are
macromolecular compounds composed of covalently bonded macromolecules, which
have been widely used in sliding wear-resistance materials in isolation
bearings. In this study, an MFT-5000 reciprocating friction testing machine was
used to compare the friction and wear performance of polyetheretherketone
(PEEK), polytetrafluoroethylene (PTFE), and ultra-high molecular weight
polyethylene (UHMWPE) under heavy load conditions in dry friction condition.
The results show that load has a significant effect on the friction
coefficient, wear rate, and wear mechanism of three materials. The instant
friction coefficient of PTFE fluctuates under high load, the wear rate clearly
increases with the increase in load. Therefore, the application under high load
conditions is limited. The wear rate of UHMWPE is the least affected by the
load among the three materials. Even when the load exceeds the yield strength,
the wear resistance is still good. The friction coefficient of PEEK decreases
with the increase in load but maintains a high value that restricts its
application in sliding friction pair materials to some degree.
load, engineering plastics,
dry friction, reciprocating friction, wear
The friction and wear performance of PEEK, PTFE, and
UHMWPE under heavy load conditions in dry friction condition was studied. Load
has a significant effect on the friction coefficient, wear rate, and wear
mechanism of three materials.
Engineering plastics are macromolecular compounds composed of covalently
bonded macromolecules, which have been widely used as mechanical moving parts
instead of steel. The American Society for Standard Testing of Materials (ASTM)
defines engineered plastics as plastics or polymer compounds having certain
properties. Due to the characteristics of high strength, low density, good self-lubricating
performance, and a relatively low friction coefficient (refers to the ratio of
the friction force between two surfaces and the vertical force acting on one
surface), engineering plastics are widely used as friction auxiliary materials
under special stress conditions such as isolation bearings for bridges and
sealing parts.1-4 Isolation bearings are used to bear and connect
the upper buildings and lower foundation. Their main function is to offset
seismic energy to achieve seismic isolation by using sliding bearing materials
and sliding panel as the reset function of movement of the reciprocating
friction. Sliding materials are mainly polytetrafluoroethylene (PTFE),
ultra-high molecular weight polyethylene (UHMWPE) and their composites, while sliding
plates are mainly composed of 06Cr19Ni10 stainless steels.5,6 The
contact load of the friction pair can exceed 50 MPa, far exceeding the
yield strength of polymer materials such as PTFE and UHMWPE,7 which
is a required condition of supercritical load. Studies have shown that PTFE is
easily cooled and has a high wear rate under high load.8-10 UHMWPE
has excellent tribological properties.11,12 However, the question
arises as to whether its unique flow stress behavior beyond the yield strength
affect the application of friction pairs under heavy loads. It is known that
polyetheretherketone (PEEK) has the characteristics of high strength, good wear
resistance, good chemical resistance.13,14 Hence, it is worth
exploring whether PEEK can be used as a friction pair material in shock
absorption structures.
The influence of the contact stress (load) on the friction and wear
behavior of engineering plastics has always been a subject of interest. A few
researchers have investigated the influence of loads on the tribological
properties of PTFE, UHMWPE and PEEK under different experimental parameters.
Jia et al. studied the self-lubricating properties of PTFE and its
nano-composites under loading conditions in the range of 1.43-8.55 MPa.15
Saikko studied the influence of load on the multidirectional sliding friction
and wear of UHMWPE.16 Laux compared the friction and wear behavior
of PEEK under 1.8 and 3.9 MPa loads.17 Rodriguez et al.
studied the dry reciprocating sliding friction wear performance of PEEK under
the loads of 4, 8, and 10 MPa, respectively.18 Zhang et al.
investigated the effect of amorphous PEEK on the wear mechanism under different
loads (1-9 N).19 Under low load condition, the experimental
parameters and materials show that the friction coefficient decreases with the
increase in load, and the wear mechanism differs with the increase in load. A
few researchers have conducted comparative studies on the friction and wear
behavior of different types of engineering plastics under different loads.
Huseyin et al. studied the tribological properties of PEEK, UHMWPE,
glass-fiber reinforced PTFE, and other composite materials under different
loads (50, 100, and 150 N) under dry friction and lubricating medium,
respectively.20 Zhiwei et al. studied the tribological
properties and wear mechanisms of PTFE, PEEK, and thermosetting resins under
low loads (15-60 N) by using a pin disc tester.21 Wang et al.
studied the tribological behavior of dry reciprocating sliding and fretting
friction of six polymer materials including UHMWPE, PTFE, phenolic aldehyde,
p-hydroxybenzaldehyde (PHBA), PEEK, and polyimide (PI) and GCr15 steel under 10
N load.22 H. Unal et al. investigated the effect of loads
(20, 30, and 40 N) on the friction and wear behavior of polyamide-6 (PA 6), polyformaldehyde
(POM), and UHMWPE.23 The above studies have compared the
tribological properties of different materials under low loads, and the
relevant experimental studies have focused on the tribological properties under
the load range below the yield strength of the materials. Few studies have attempted to
understand the laws of friction and wear performance of engineering
plastics under the condition of large loads exceeding the yield strength of
materials. The change compared to the case of low loads needs to be examined in
detail.
This work focuses on three engineering plastics i.e. PTFE, UHMWPE, and
PEEK, and uses MFT-5000 reciprocating friction and wear testing machine (Rtec
Instrument, USA) to determine the friction coefficient and wear rate under different
loads (10, 15, 20, 25, and 30 MPa). Using scanning electron microscopy (SEM),
white light confocal 3D topography, and energy dispersive X-ray spectrometry
(EDS), we have comparatively studied the wear surface morphology and discussed
the wear mechanisms of the three materials under different loads.
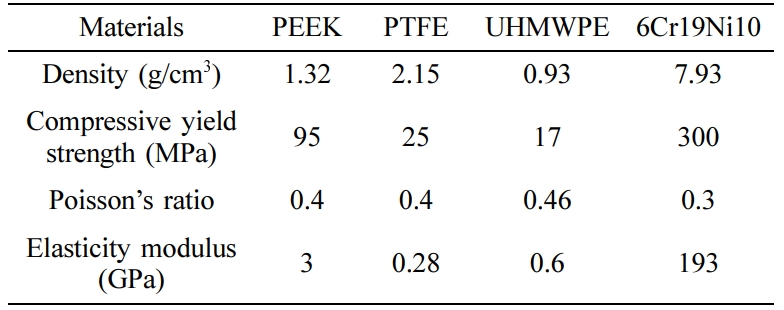
Materials. Three
commercial-grade engineering plastics (PTFE, UHMWPE, and PEEK) pin samples and
06Cr19Ni10 steel plate samples were used as friction pairs in the experiment.
Their material properties were obtained from the Shenzhen senli plastic
material co. Ltd, as shown in Table 1. The pin samples were prepared by turning
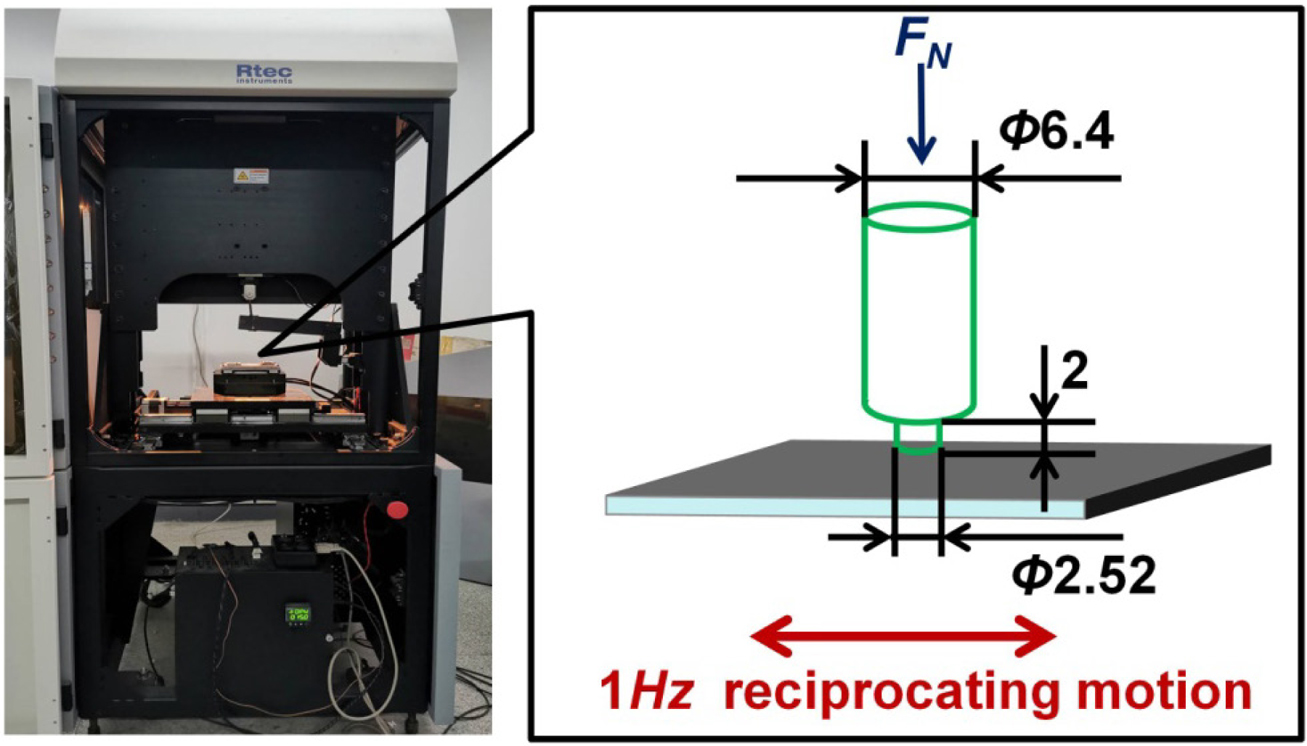
the engineering plastic bars. The diameter of the frictional contact between
the pin samples and steel plate samples was 2.52 mm. The 06Gr19Ni10 steel plate
was cut into 30×30×3 mm using wire cutting. The friction surface of the
samples was mirror polished by metallographic polishing. The size and the
contact form of the friction pair are shown in Figure 1.
Design. In order to
achieve the specific pressure conditions required for the experiment and ensure
the stable operation of the experimental equipment. The contact pressure was
calculated as 30 MPa when the testing machine pressure was 150 N. The
radius of the friction pin was calculated as R=1.26 mm. The
engineering plastics are machined to the corresponding size by turning.
The engineering plastic pin samples and 06Gr19Ni10 piece samples were
installed on the MFT-5000 reciprocating friction and wear tester (Rtec
Instrument, USA) to conduct reciprocating sliding wear tests. The experimental
method was dry rubbing under ambient temperature at 25 ℃ and relative
humidity 70%. Before the test, the sample was cleaned by ultrasonic rays with
anhydrous ethanol. In order to study the influence of load variation on the
friction and wear properties of different engineering plastics, all the
friction tests were conducted for 30 min under the condition of
reciprocating friction frequency of 1 Hz and a contact pressure of 10, 15, 20,
25, and 30 MPa, respectively. The specific experimental parameters are
shown in Table 2. After the test, the pin sample was removed from the test
machine, soaked in anhydrous ethanol reagent for ultrasonic cleaning for 180 s,
placed in an oven at a temperature of 40 ℃ for 24 h, and then removed and
stored in a drying dish for analysis.
Characterization. SEM (JSM-6510LV),
white light confocal microscopy (CM, Micromeasure2 STLE France), and EDS were
used to characterize the microscopic morphology and chemical composition of the
worn surface, observe the wear morphology of the three engineering plastic
samples under different loads, and discuss the law of influence of the load on
the wear mechanism of the three materials. After the samples were dried in the
oven, a precision analytical balance (precision ± 0.0001 g) was used to
measure the mass loss of the friction pins five times. Then, the average
value was converted to the material wear rate W (refers to the volume of
wear per unit of load per unit of length) by the following calculation
method:24
W = Dm/(r × F × d)[mm3/(Nm)] (1)
Where, ρ is the material
density (g/mm3), F is the normal load (N), and d is the
friction sliding distance (m).
|
Figure 1 Schematic diagram of the contact and size of the friction
pair. |

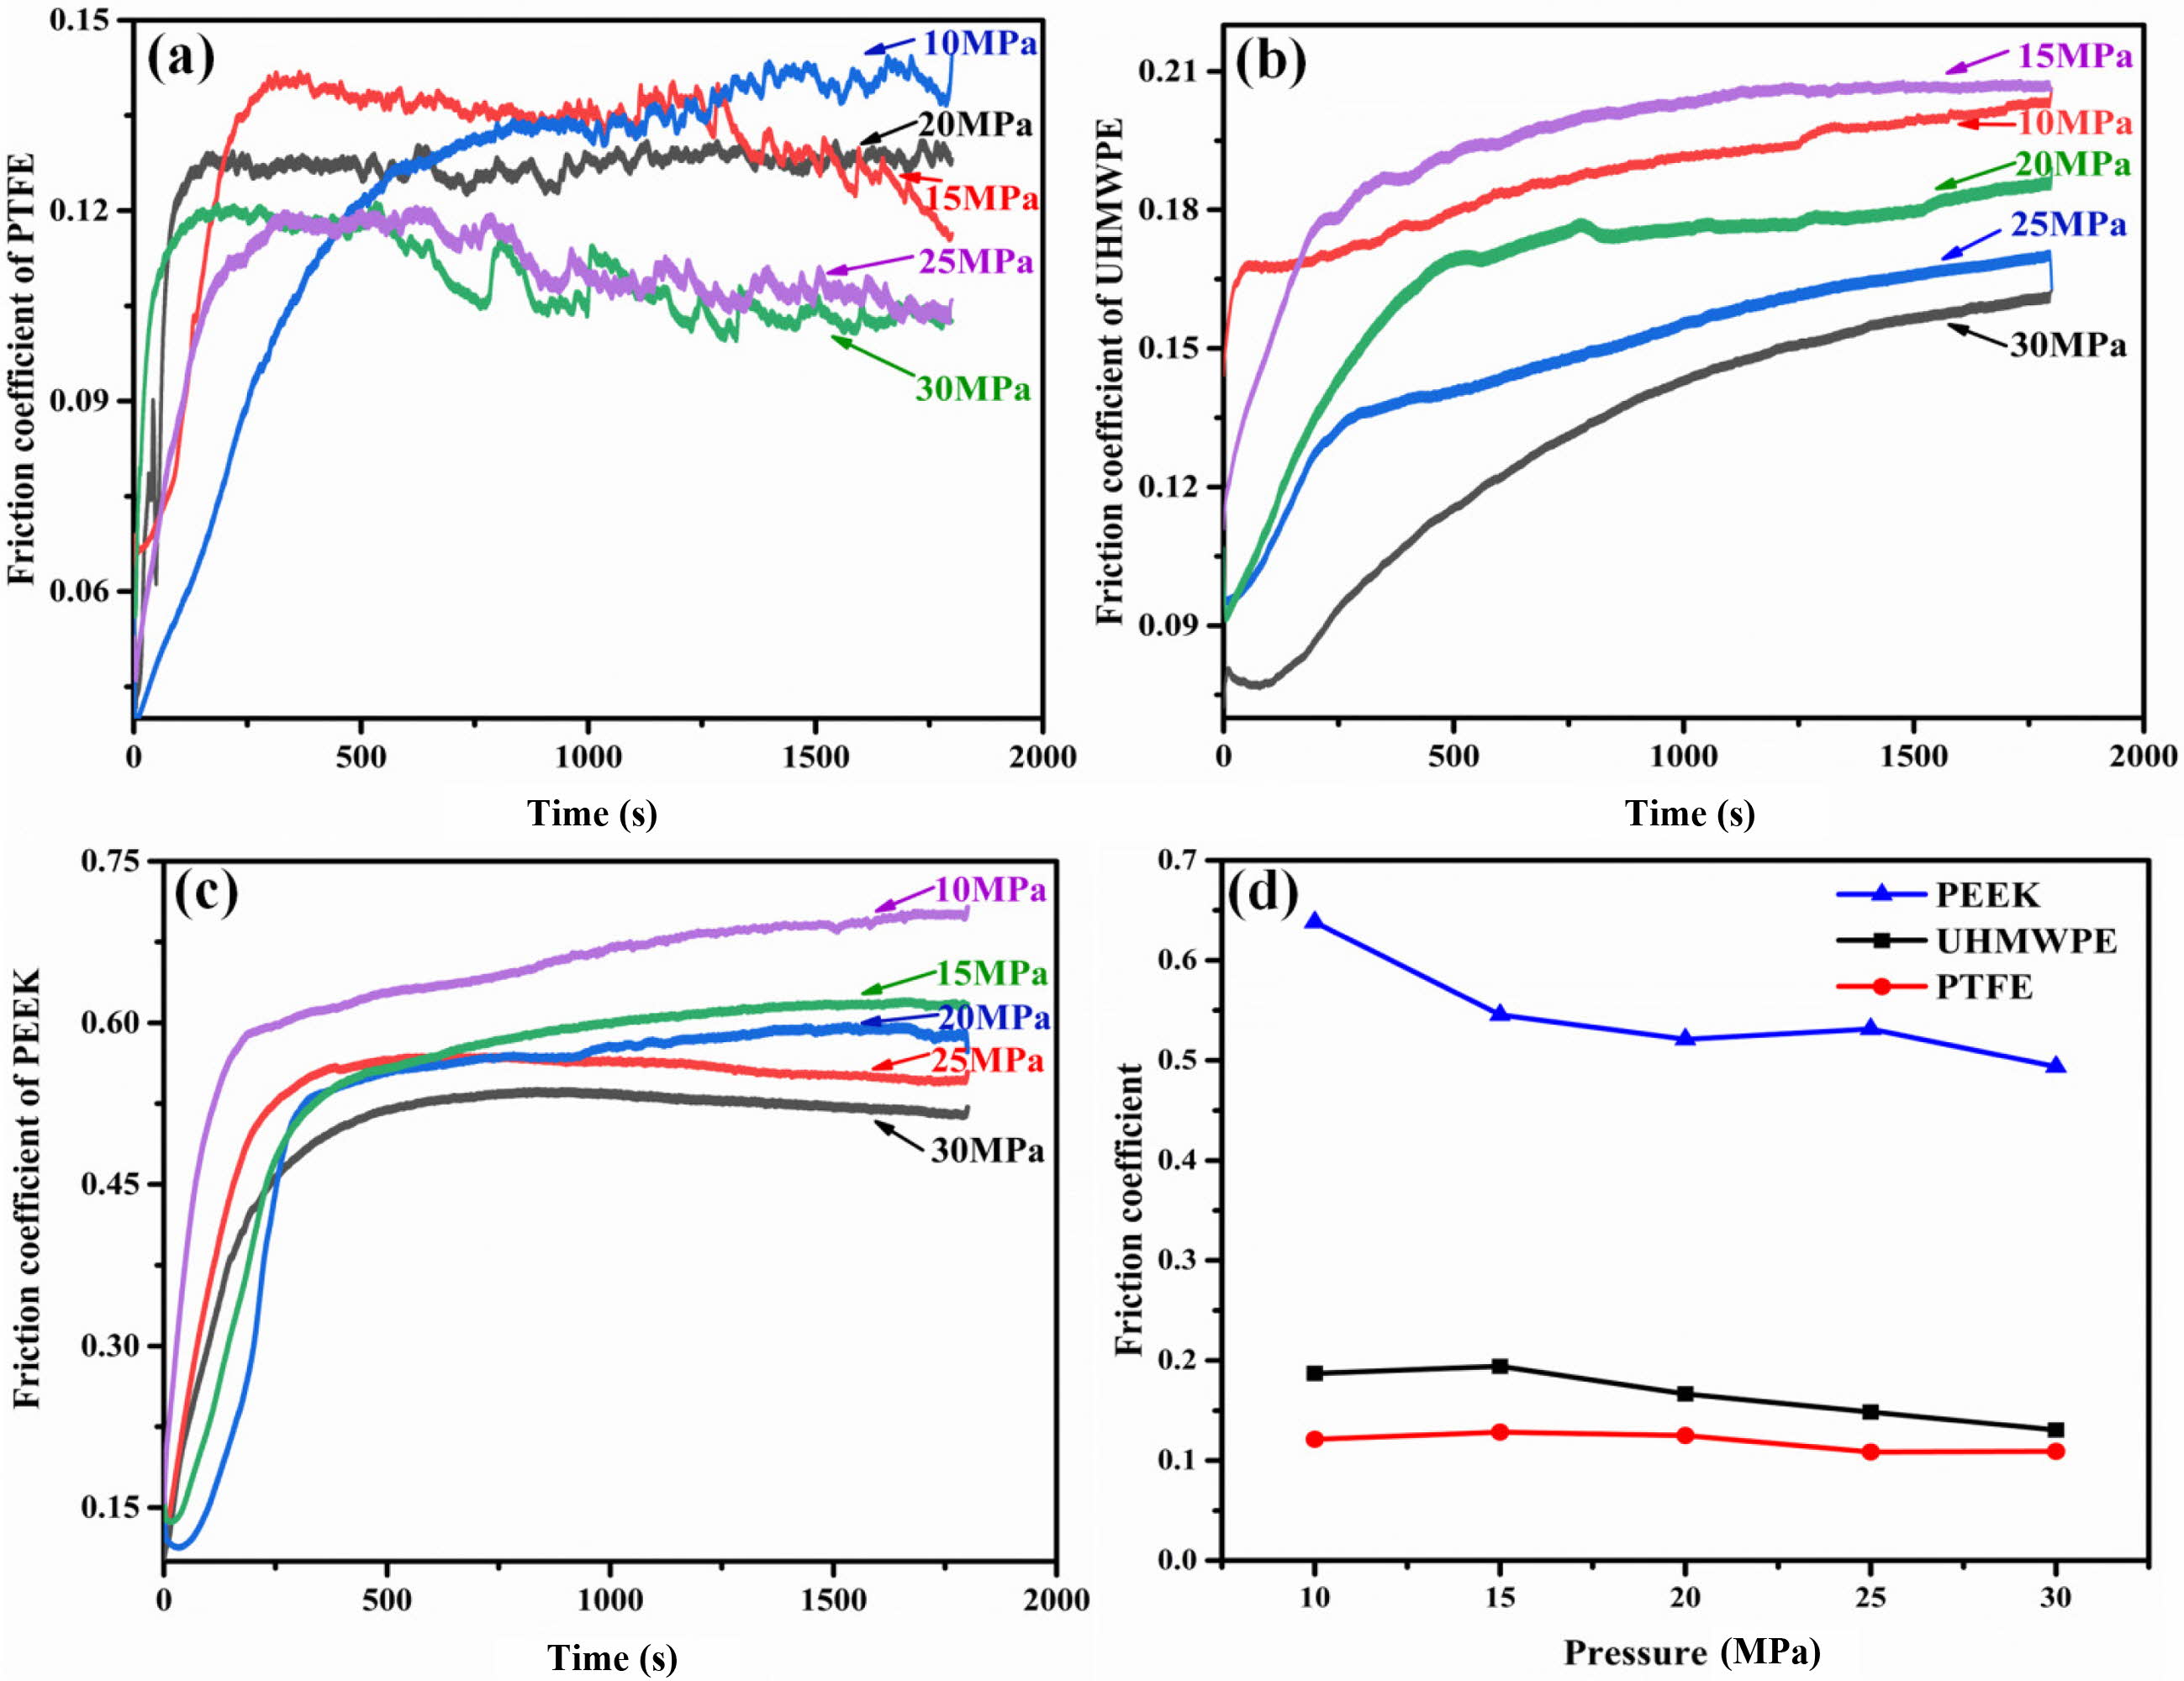
Influence of Load on the Friction Coefficient of Materials. Figure 2(a-c)
shows the variation of the friction coefficient with reciprocating sliding time
of PTFE, UHMWPE, and PEEK under different loads, respectively. The friction
coefficient curves of the three engineering plastics all show the
characteristics of rapid rise and then smooth transition. The rapid rise stage
is short, approximately 100-400 s. The initial slope of PTFE in the early
rise stage increases with the increase in the load, while the time to enter the
stable stage decreases. When the experimental load (10 and 15 MPa) is
lower than the yield strength of the material, the slope is small, and the time
to enter the stable friction state is longer. When the experimental load
reaches 30 MPa, the time to enter the stable period is the shortest. When
the experimental load is greater than the yield strength (> 20 MPa),
the friction coefficient in the stable stage decreases. In the early friction
rise stage of UHMWPE, the trend is opposite to that of PTFE i.e. the slope decreases
with the increase in load. When the experimental load (30 MPa) is greater
than the yield strength condition, the friction coefficient gradually decreases
in the initial stage and then gradually increases. After reaching the stable
friction state, the friction coefficient of UHMWPE still presents a trend of
slow increase. In the early rising stage of PEEK, the slope does not change
markedly with load variation. After reaching the stable stage, the friction
coefficient still increases slowly under the experimental load of 10–20 MPa,
while the friction coefficient is relatively stable under the experimental load
of 25 and 30 MPa.
It can be observed from Figure 2 that the friction coefficient of the
three materials in the stable stage all show a trend of decrease with the
increase in load. Compared with PEEK and UHMWPE, the friction coefficient of
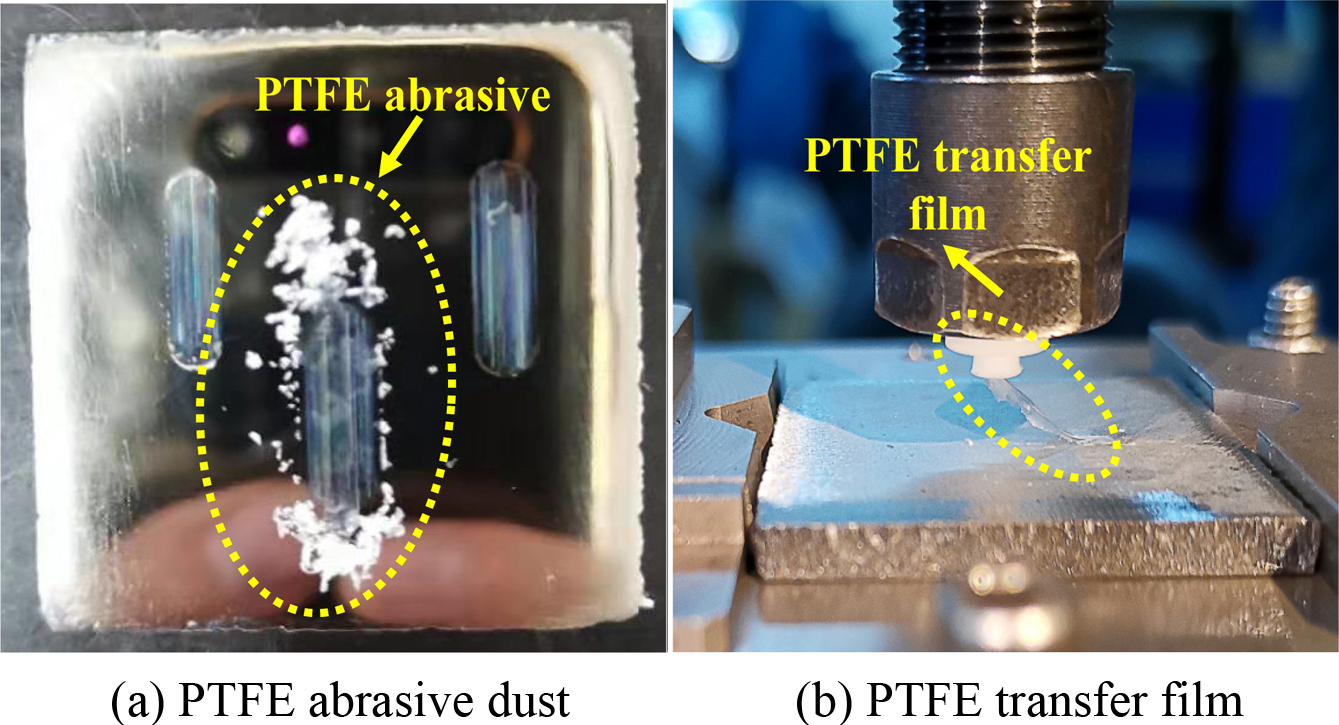
PTFE appears to have the most fluctuation. The friction coefficient fluctuates
more clearly for greater load. The reason is that: PTFE has poor mechanical
properties i.e. its surface material wears off most easily in the process of
friction, and as abrasive dust is formed on the friction interface (as shown in
Figure 3(a)), the friction coefficient clearly fluctuates. The wear abrasive
dust forms a uniform transfer film on the surface of the friction pair parts
and has the effect of solid lubrication25-27 (as shown in Figure
3(b)), resulting in PTFE having the minimum friction coefficient among the
three materials.
Figure 2(d) shows the average friction coefficient of PEEK, PTFE, and
UHMWPE under different loads (the calculation method is described in Characterization
section). As shown in the figure, the average friction coefficient of
PTFE is the least, followed by UHMWPE, and PEEK is the largest. The average
friction coefficient of the three materials shows a decreasing trend with the
increase in load, while the trend is the most pronounced in PEEK. The stability
of the average friction coefficient with the variation of load is in the order
PTFE > UHMWPE > PEEK.
Influence
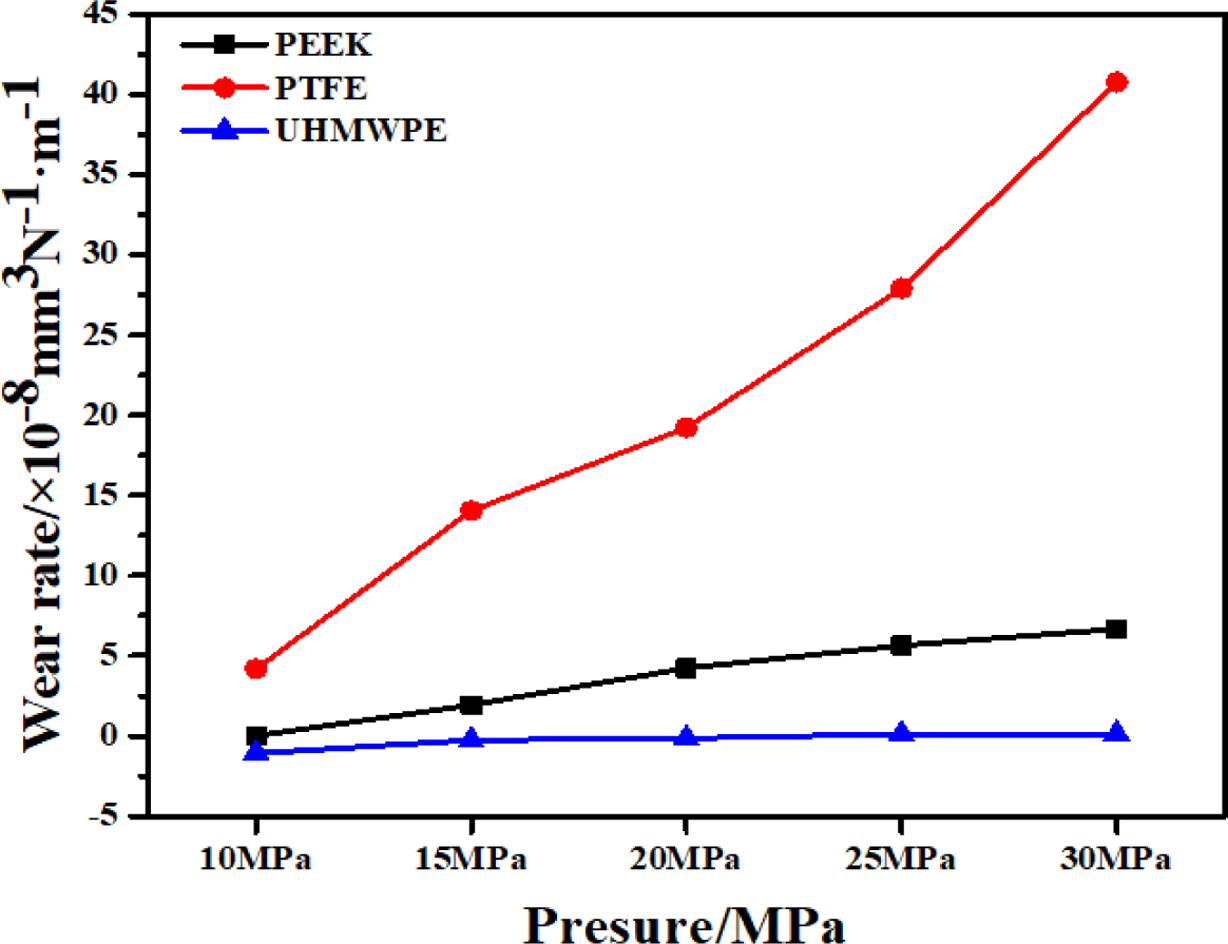
of Load on the Wear Rate of the Materials. Figure 4 shows the
relationship between the wear rate and the load of PEEK, PTFE, and UHMWPE after
30 min of sliding reciprocating friction with a frequency of 1 Hz. It can
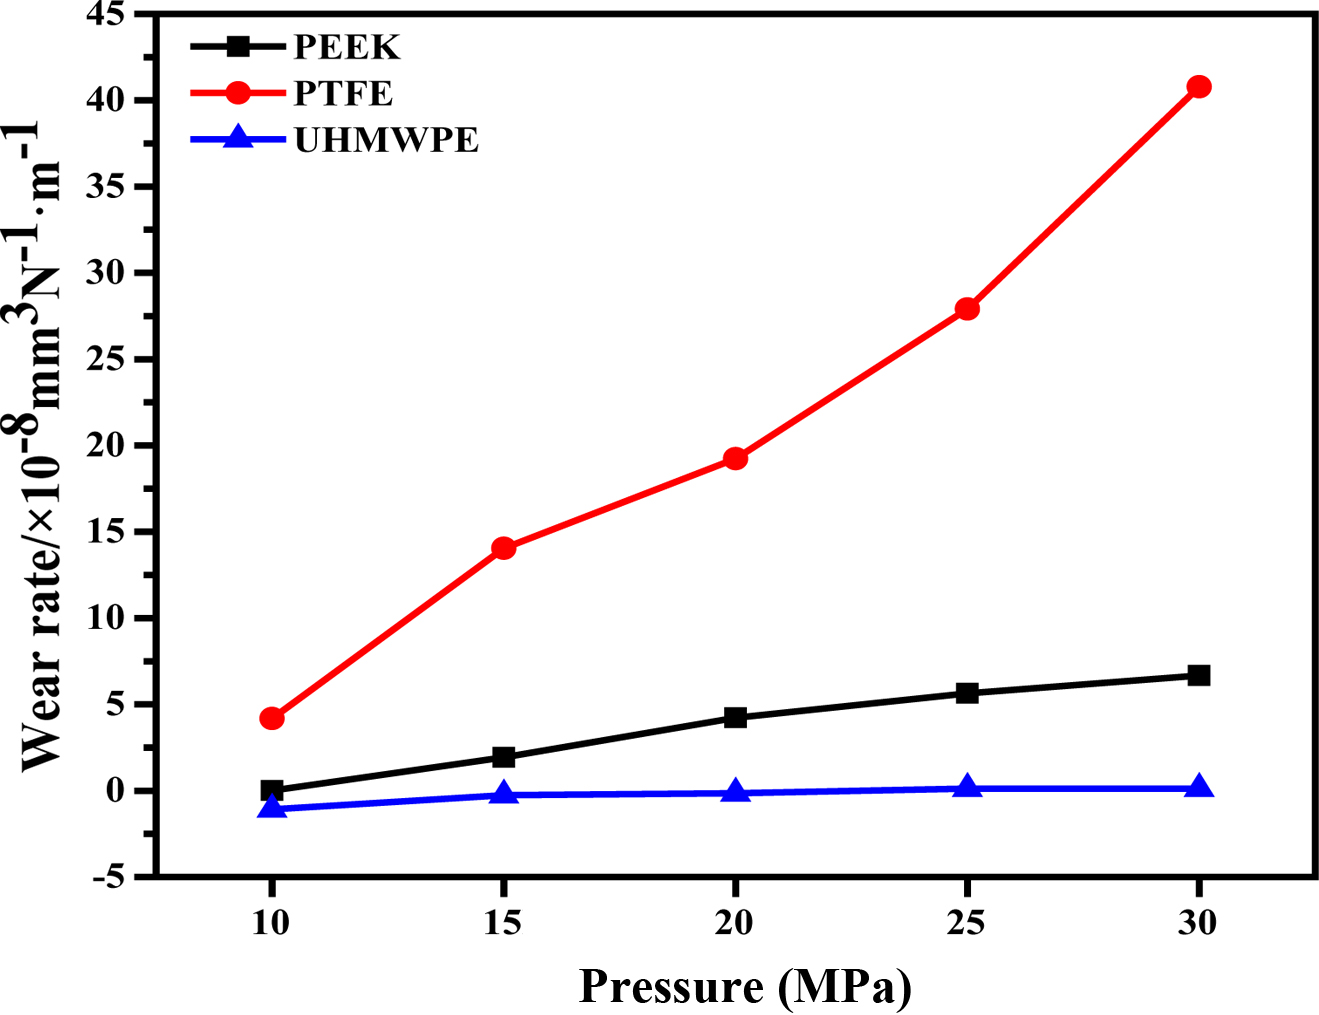
be observed from the figure that the wear rate of the three materials increases
with the increase in the load. Under the same friction condition, the wear rate
and the rate of change are shown to vary as PTFE > PEEK > UHMWPE. The
wear rate of UHMWPE is the lowest, and the wear rate change is relatively stable,
which is 1.0753–0.1195×10⁻⁸ mm3N-1·m-1.
Under small
loads, the UHMWPE wear rate is negative. This may be because UHMWPE has good
wear resistance, so that the wear mass loss is low, and in the process of
friction, the elements of the steel plate pairs adhere and transfer to the
surface of UHMWPE, which results in increased friction pin quality.28
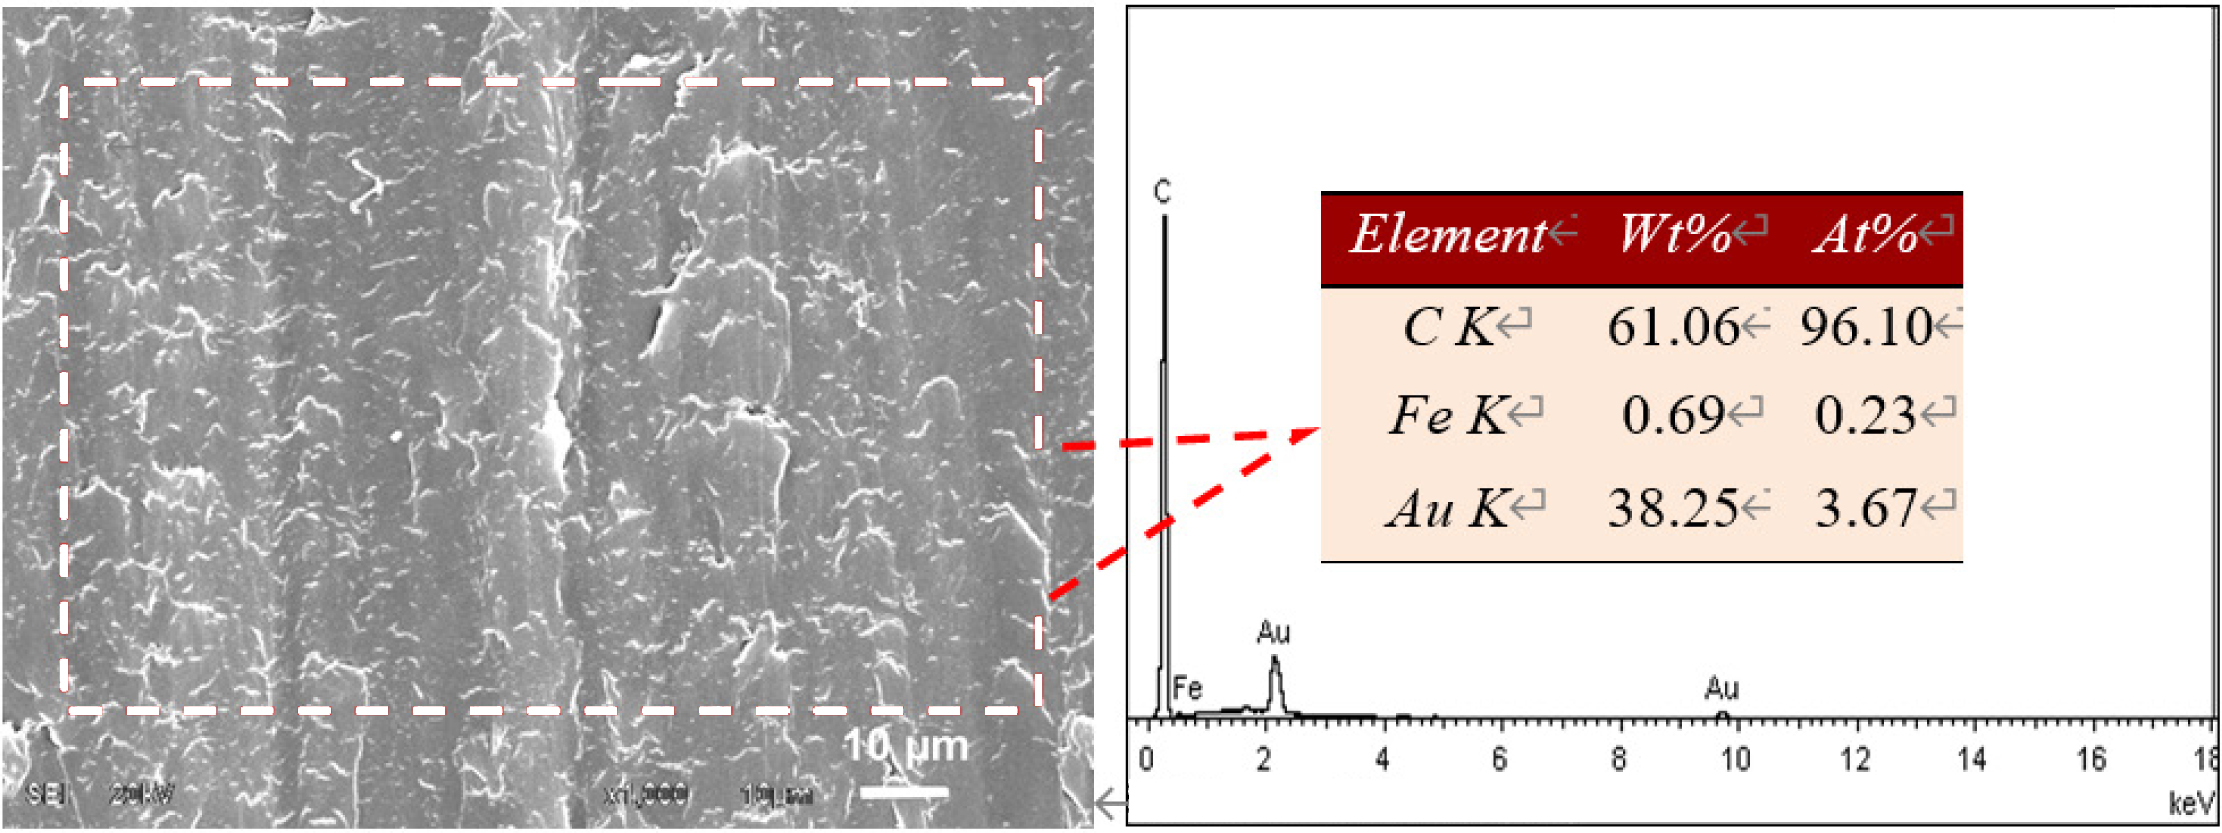
According to the element content analysis on the wear surface of the UHMWPE
friction pin (Figure 5), the worn Fe content of the UHMWPE friction pin reaches
0.69% under 15 MPa load, indicating that Fe element is transferred to the
UHMWPE surface during the reciprocating friction process, which may lead to
negative wear. With the increase in load, UHMWPE gradually deforms plastically,
which results in increased material wear. The wear weightlessness is greater
than the increased weight caused by the transfer of elements, so that the
weights of the material wear quantitative changes are positive. The changes of
the wear rate of UHMWPE are the most stable, and the absolute value is the
minimum, which shows that UHMWPE can exhibit good wear resistance even when the
load is greater than the material yield strength.
With the increase in load, the wear rate of PTFE increases almost
linearly, and when the experimental load is greater than the yield strength,
the wear rate increases much more than that at low load. The wear rate under a
load of 30 MPa is 8 times that under 10 MPa, and the load has a significant
impact on the wear behavior of PTFE. This is because the van der Waals
attraction between the PTFE molecules is small, which facilitates bond slip.
PTFE has good self-lubricating performance, and deforms with the increase in
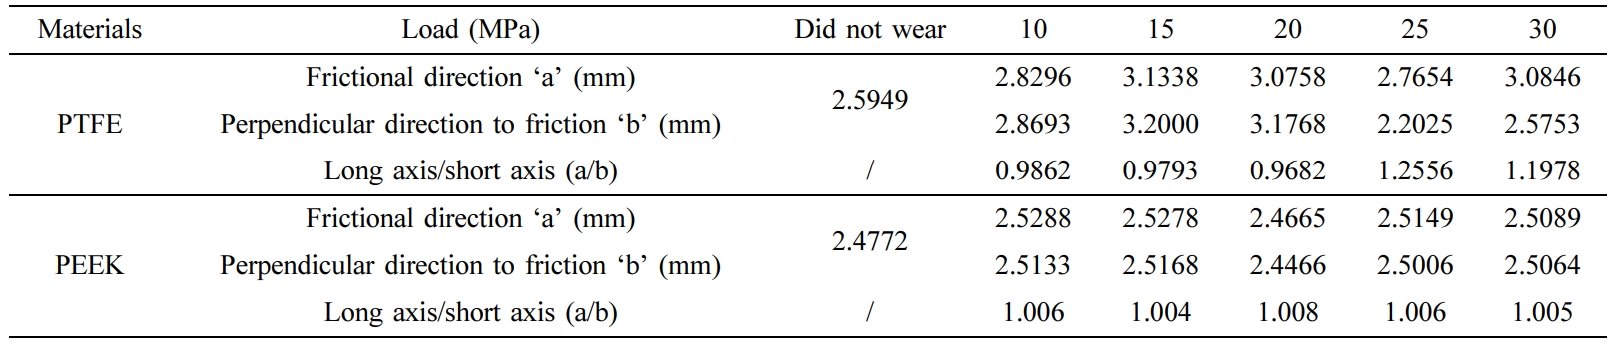
load under the condition of heavy load.29,30 Table 3 shows the pin
sample size measured by white light confocal microscopy. It can be observed
that when the test load is less than 20 MPa, the friction end surface of the
sample is basically round, and the long axis/short axis is close to 1. When the
test load is 25 MPa (close to the yield strength), the deformation of the
friction end surface of the sample increases, and it becomes longer along the
direction of friction and shorter perpendicular to the direction of friction.
At 30 MPa, under the interaction of wear, the friction end surface of the
sample presents an irregular ellipse. As the load increases, the change of diameter
ratio of the friction direction/perpendicular direction to friction of PTFE
indicates that the plastic rheology along the frictional direction is the main
factor that affects the frictional and wear properties under the loading
conditions close to and exceeding the yield strength.
The wear rate of PEEK is between 0.0561–6.6659×10⁻⁸ mm3N-1·m-1, and the wear rate
and rate of change are between UHMWPE and PTFE. Its friction
direction/perpendicular direction diameter is shown in Table 3. The shape of
the friction surface of the material basically does not change with the load,
which indicates that PEEK has relatively stable mechanical properties under
this experimental condition.
Wear
Mechanism Analysis. In order to better analyze and compare the friction and
wear mechanisms of PEEK, PTFE, and UHMWPE under different loads, the
microscopic wear morphologies of the three engineering plastics under
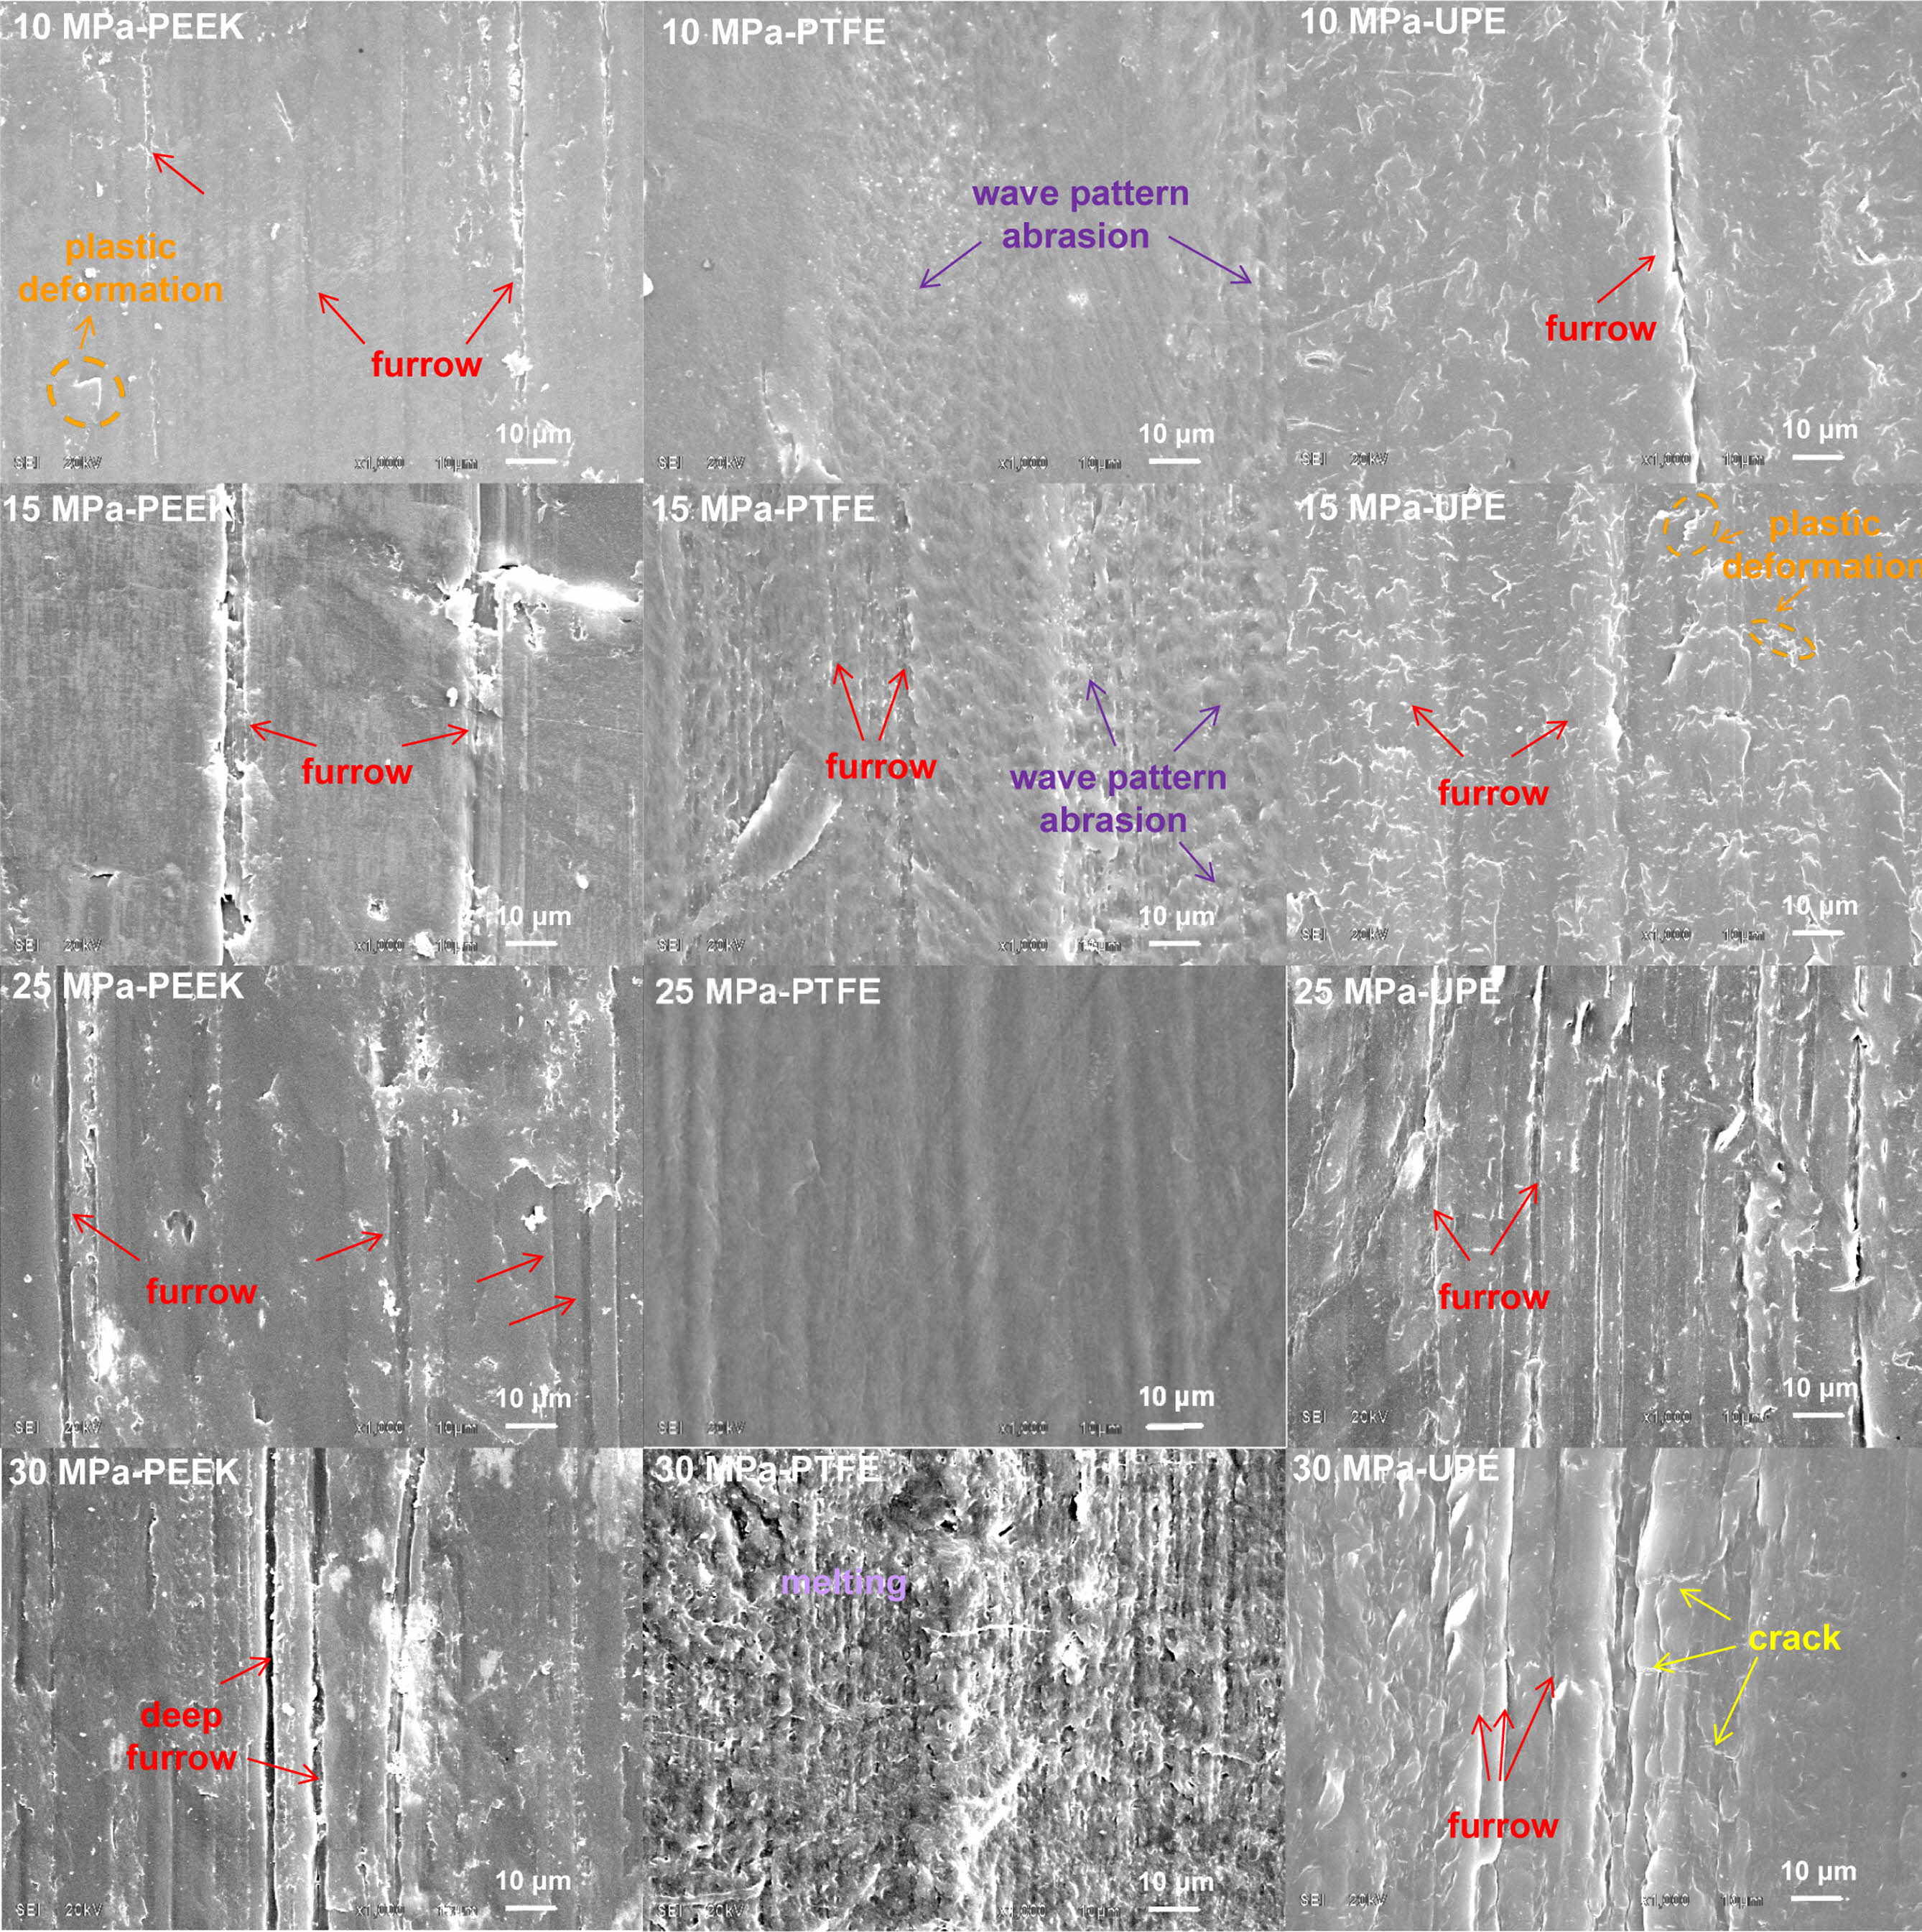
reciprocating friction are studied by SEM. Figure 6 shows the microscopic
surface morphologies of the three engineering plastics after reciprocating wear
and tear after magnification to 1000×. It can be observed from the figure that
the load has a significant impact on the wear morphology of the three
materials, which is discussed as follows:
The wear morphology of PTFE is complex with change of load. When the
experimental load (10 and 15 MPa) is less than the yield strength, the wear
morphology of PTFE is characterized by material folding. The material folding
under 15 MPa increases more significantly compared with that under
10 MPa, and a few furrows appear. The increase in load increases the material
flow and thus aggravates the material wear. When the experimental load (25 MPa)
is equivalent to the yield strength, the wear surface is gradually smoothed
with the increase in material flow. When the experimental load (30 MPa) is
greater than the yield strength, partial melting occurs on the surface of PTFE,
which further accelerates the wear process of the material. Therefore, the wear
rate of PTFE increases significantly with the increase in load, and the wear
rate under load greater than the yield strength changes much more than that
under lower load, which limits its application under large loads.
Simultaneously, the increase in the load shortens the shedding process of the
material in the friction process, such that the slope of the friction
coefficient increases with the increase in load in the early rising stage. Due
to the factors of material melting and stress distribution inequality, PTFE
molecular chains break, resulting in part of the flexible chain separating from
the matrix. As shown in Figure 3(b), the material separates from the matrix in
the form of a transfer film. The transfer film on the surface of the friction
pair of 6Cr19Ni10 causes the friction coefficient to have a downward trend in
the stable stage when the experimental load is greater than the yield strength.
The wear morphology of UHMWPE is also significantly affected by the load.
When the experimental load (10 and 15 MPa) is less than the yield strength,
the wear morphology of UHMWPE is mainly furrow wear. When the load increases to
15 MPa, the number of furrows on the UHMWPE surface gradually increases,
and a small amount of plastic deformation occurs. When the experimental load
(25 and 30 MPa) is greater than the yield strength, the furrows on the
surface of the material further increase in number than those under small
loads. When the load is 30 MPa, due to the effect of high cycle contact stress,
repeated deformation of the material accelerates fatigue. Hence, fatigue wear
occurs and leads to not only furrow wear but also, cracks on the surface of
UHMWPE. Therefore, the wear rate of UHMWPE increases with increase in load.
However, compared to PEEK, under the same load, the furrows are more obvious, and
hence the wear rate of UHMWPE is less than that of PEEK, indicating that the
load has an insignificant effect on the wear rate. Under the load greater than
the yield strength, both have good wear resistance, which is consistent with
the result shown in Figure 4. When the load is greater than the yield strength,
in the initial friction stage, the contact of the rough peaks of the UHMWPE
surface leads to rapid increase in the actual contact stress, and the reduction
of the friction coefficient. Subsequently, as the friction surface furrows and
cracks appear due to friction, the roughness increases gradually. Therefore,
under the load of 30 MPa, the friction coefficient of UHMWPE decreases first
and then increases.
The strength of PEEK is so high that all the experimental conditions in
this study have not reached the yield strength of the material yet. The wear
surfaces are all shown as furrows or scratches along the direction of sliding
friction. Under 10 MPa load, the wear surface appears to have shallow furrows
with a small amount of plastic deformation. With the increase in load (15 and
25 MPa), the number of furrows gradually increases. At 30 MPa, the PEEK surface
shows wear morphology consisting of more obvious furrows. The main reason is
that the PEEK surface roughness peaks locally cause stress concentration on the
furrows. With the increase in load, the roughness peaks and abrasive chips are
embedded and generate a high contact stress under the action of normal loads.
Hence, the degree of mutual embedding is strengthened, which results in more
furrows. Therefore, with the increase in load, the wear rate increases
gradually, and is slightly greater than that of UHMWPE, but assumes a low
value.
|
Figure 2 Reciprocating friction coefficients under different loads: (a)-(c) are the real-time friction coefficients of PTFE, UHMWPE, and
PEEK, respectively; (d) average friction coefficient of the three engineering plastic materials. |
|
Figure 3 Material loss of PTFE in the friction process: (a) abrasive
dust; (b) transfer film. |
|
Figure 4 Wear rate curve of PTFE, UHMWPE, and PEEK with the
change of load. |
|
Figure 5 SEM photographs and EDS analysis of UHMWPE after the reciprocating friction experiment under the contact pressure of 15 MPa. |
|
Figure 6 SEM images showing the worn surfaces of PEEK, PTFE, and UHMWPE under different contact pressures. |
|
Table 3 Size Changes of PTFE and PEEK after Friction Test under Different Loads |
In this study, we have examined the effect of loads on the tribological
and wear properties of PTFE, UHMWPE, and PEEK. The conclusions are summarized
as follows:
(1) PTFE has good running performance, with the lowest average friction
coefficient and is least influenced by load. However, at the instant the
friction coefficient fluctuates under high load, the wear rate clearly
increases with the increase in load. When the load exceeds the yield strength,
the rheology of the material aggravates the wear. Therefore, the application
under high load conditions is limited.
(2) The average friction coefficient of UHMWPE is slightly higher than
that of PTFE, and the friction coefficient gradually decreases with the
increase in load. The wear rate of UHMWPE is the least affected by the load
among the three materials. Even when the load exceeds the yield strength, the
wear resistance is still good. Therefore, it is widely used under the load
condition of 30 MPa or higher.
(3) PEEK has high mechanical strength. The test conditions in this study
are not as high as its yield strength, and the wear rate gradually increases
with the increase in load, which is slightly greater than UHMWPE, but assumes a
low value. The friction coefficient decreases with the increase in load, but
maintains a high value that restricts its application in sliding friction pair
materials to some degree.
(4) The wear mechanism of the three materials evidently differs with the
load. The wear mechanism of PTFE under small loads (10 and 15 MPa) is
material folding. As the load increases, the folding increases. When the load
reaches 30 MPa, PTFE melts. Under low loads (10 and 15 MPa), the wear mechanism
of UHMWPE is furrow wear and a small amount of plastic deformation occurs. As
the load increases, the furrows gradually increase in number and become more
obvious. When the load reaches 30 MPa, the wear mechanism is furrow wear and
crack fatigue wear. The wear mechanism of PEEK is mainly furrow wear, and the
furrows increase in number and become more obvious with the increase in load.
- 1. P. Marcela, D. Bernadette, K. Thomas, and A. Vasiliki-Maria, Int. J. Surf. Sci. Eng., 11, 65 (2017).
- 2. B. B. Chen, J. Z. Wang, and F. Y. Yan, Tribol. Lett., 42, 17 (2011).
-

- 3. K. Neelima, K. L. Prav, N. L. Soni, and R. J. Patel, Wear, 342, 85 (2015).
-
- 4. J.-H. Han, H. Zhang, P.-F. Chu, A. Imani, and Z. Zhong, Compos. Sci. Technol., 114, 1 (2015).
-
- 5. M. Dolce, D. Cardone, and F. Croatto, Bull. Earthquake. Eng., 3, 75 (2005).
-
- 6. D. Sattar, R. J. Kristopher, M. Marc, W. H. Marvin, J. B. Paul, and C. Michael, J. Bridge. Eng., 24, 04019045 (2019).
-
- 7. D. L. Winstead, D. Flowers, and C. E. Pyers, Guide specifications for seismic isolation design, 3rd ed. H. S, Washington D.C, 2010.
- 8. J. P. Wang, D. X. Liu, H. B. Ke, D. G. Xiang, Y. Liu, L. Dai, and X. H. Zhang, Mech. Sci. Technol. Aerosp. Eng., 35, 646 (2016).
- 9. J. Q. Zhang, H. X. Huang, R. H. Ju, K. T. Chen, S. B. Li, W. J. Wang, and Y. S. Yan, Am. J. Surg., 213, 87 (2016).
-
- 10. G. W. Sawyer, K. D. Freudenberg, P. Bhimaraj, and L. S. Schadler, Wear, 254, 573 (2003).
-
- 11. Q. F. Wang, H. L. Wang, Y. X. Wang, and F. Y. YAN, Tribol., 35, 441 (2015).
- 12. D. I. Chukov, A. A. Stepashkin, A. V. Maksimkin, V. V. Tcherdyntsev, S. D. Kaloshkin, K. V. Kuskov, and V. I. Bugakov, Compos. Part B-Eng., 76, 79 (2015).
-
- 13. G. D. Yao, W. D. Wang, J. F. Shen, M. J. Du, and M. M. Si, Mater. Sci. Technol., 26, 56 (2018).
- 14. F. Quadrini and E. A. Squeo, Express. Polym. Lett., 1, 817 (2007).
-
- 15. Z. N. Jia and Y. L. Yang, Compos. Part B-Eng., 43, 2072 (2012).
-
- 16. V. Saikko, Proc. Inst. Eng. H., 220, 723 (2006).
-
- 17. K. A. Lauxa and C. J. Schwartz, Wear, 297, 919 (2013).
-
- 18. R. F. Vanessa, S. Jacob, P. D. Yeczain, D. B. Patrick, and A. Mátyás, Int. J. Sustain. Constr. Des., 4, (2013). DOI:10.21825/scad.v4i2.1043.
-
- 19. G. Zhang, C. Zhanga, P. Nardin, W. Y. Li, H. Liao, and C. Coddet, Tribol. Int., 41, 79 (2008).
-
- 20. H. Unal and A. Mimaroglu, J. Polym. Eng., 32, 349 (2012).
-
- 21. Z. W. Guo, S. F. Li, and K. L. He, Eng. J. Wuhan Univ., 52, 557 (2019).
- 22. Q. F. Wang, Y. X. Wang, H. L. Wang, N. Fan, and F. Y. Yan, Tribol. Int., 104, 73 (2016).
-
- 23. H. Unal and A. Mimaroglub, Mater. Design., 24, 183 (2003).
-
- 24. A. A. Pitenis, K. L. Harris, C. P. Junk, G. S. Blackman, W. G. Sawyer, and B. A. Krick, Tribol. Lett., 57, 4 (2015).
-
- 25. J. Ye, H. S. Khare, and D. L. Burris, Wear, 297, 1095 (2013).
-
- 26. K. Makinson and D. Tabor, Nature, 201, 464 (1964).
-
- 27. T. A. Blanchet and F. E. Kennedy, Wear, 153, 229 (1992).
-
- 28. K. L He, C. X. Sheng, Z. W. Guo, Y. W. Sun, and C. Q. Yuan, Lubr. Eng., 4, 54 (2019).
- 29. V. N. Aderikha, A. P. Krasnov, and A. V. Naumkin, Wear, 386-387, 63 (2017).
-
- 30. B. M. Rudresh and B. N. Kumar, Trans. Indian Inst. Met., 71, 339 (2018).
-
- Polymer(Korea) 폴리머
- Frequency : Bimonthly(odd)
ISSN 0379-153X(Print)
ISSN 2234-8077(Online)
Abbr. Polym. Korea - 2022 Impact Factor : 0.4
- Indexed in SCIE
 This Article
-
2020; 44(6): 827-834
Published online Nov 25, 2020
- 10.7317/pk.2020.44.6.827
- Received on Jun 16, 2020
- Revised on Aug 11, 2020
- Accepted on Aug 12, 2020
Services
Shared
Correspondence to
- Duan Haitao and Li Jian
-
State Key Laboratory of Special Surface Protection Materials and Application Technology, Wuhan Research Institute of Materials Protection, Wuhan 430030, Hubei, China
- E-mail: duanhaitao2007@163.com, lijianwuhan@163.net
- ORCID:
0000-0002-6892-4897, 0000-0002-9228-6469
Hyecheon Building(Room 601), #354, Gangnam-Daero, Gangnam-Gu, Seoul 06242, Korea
TEL : 82-2-568-3860, 561-5203, 569-3860 FAX : 82-2553-6938 E-mail: polymer@polymer.or.kr