


- Wear Characterization of Reinforced Polyurethane Composites Producedvia Vacuum Casting
Sait Koçak and Yavuz Kaplan*,†

Mechatronics Engineering, Faculty of Technology, Pamukkale University, Denizli 20160, Turkey
*Mechanical Engineering, Faculty of Technology, Pamukkale University, Denizli 20160, Turkey- 진공주조에 의해 생산된 강화 폴리우레탄 복합재의 마모특성
Reproduction, stored in a retrieval system, or transmitted in any form of any part of this publication is permitted only by written permission from the Polymer Society of Korea.
In recent years, research relating to polyurethane has been growing because of the lightness, low cost, and favorable mechanical properties of this material. The increased usage areas of polyurethane in tribological systems make it very important to determine its wear behavior. This study focuses on the wear characterization of polyurethane composites reinforced with glass fiber, SiC, and Al2O3. The wear tests were carried out using a pin-on-disc test apparatus against an abrasive counter-face at different applied loads (5 and 10 N). Scanning electron microscopy was used to observe the damage on the worn surfaces. The wear experiments clearly demonstrated that the reinforcement materials significantly affected the tribological properties of the polyurethane composites. In addition, it was observed that particle reinforcement was more effective than fiber reinforcement under experimental conditions. Consequently, polyurethane with glass fiber, SiC, and Al2O3 fillers would be a suitable candidate for use in tribological applications.
This study focuses on the wear characterization of polyurethane (PU) composites reinforced with glass fiber, SiC, and Al2O3 samples produced by vacuum silicon casting. The wear experiments clearly demonstrated that the reinforcement materials significantly affected the tribological properties of the PU composites.
Keywords: polyurethane, reinforced thermoplastic, vacuum casting, tribological.
Vacuum casting is a widely used rapid prototyping method. In cases where the number of pieces to be produced is low, its high mold accuracy,1,2 low cost,3 and adaptability to different molds and resins4 contribute to the attraction of the vacuum casting method. Vacuum casting is frequently used in defense industry applications where the number of parts to be produced is low, during the prototype production stages of automobiles, and during the restoration of classic vehicles. This technique allows faster and higher-strength products than with additive manufacturing (three-dimensional printers).5
In the vacuum casting method, silicone is often used as the mold material when the number of pieces is fewer than 30. Because of the degradation occurring in the silicone mold when castings are made for more than 30 pieces, different materials are preferred in this case.6 Polyurethane (PU) is one of the most commonly used casting materials in silicone-mold vacuum casting method. Polyurethane vacuum casting is used for industrial products that do not involve mass production7 or rapid prototyping5 and in various research areas.8 Various reinforcement materials are added to polyurethane resins to improve their mechanical and tribological properties. The reinforcement ratio and the reinforcement material both have an important effect on the mechanical properties of the polyurethane.
Carbon fibers (CF),9,10 glass fibers (GF),11,12 and other reinforcement materials are widely used in PU because of their high hardness, high specific strength, and outstanding wear resistance.13 The improvements achieved in the mechanical and tribological properties of reinforced polyurethane materials manufactured by traditional methods have led to the idea of creating reinforcements for PU materials produced via vacuum silicon casting.
This research aims to produce industrially applicable and utilizable composite materials beyond laboratory-scale studies.14-17 For this purpose, chopped GF, silicon carbide (SiC), and aluminum oxide (Al2O3) were added to PU test samples produced by vacuum silicon casting. The effects of the reinforcement materials on the wear characteristics of the polyurethane were investigated. In addition, the weight ratios of the added reinforcement materials were systematically increased to determine the optimum reinforcement ratios.
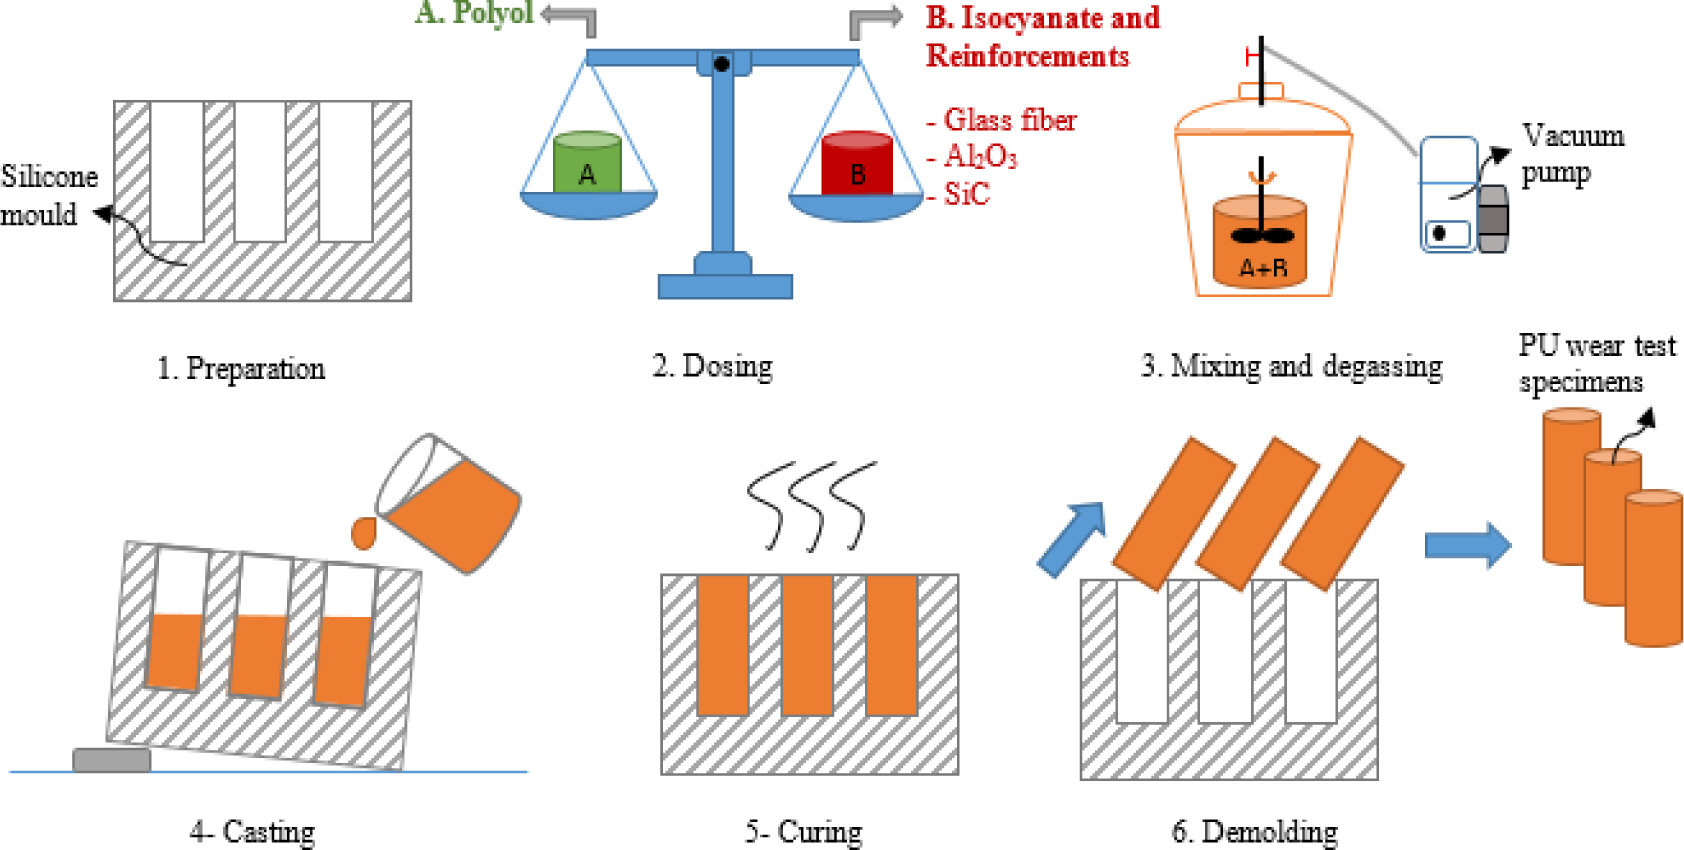
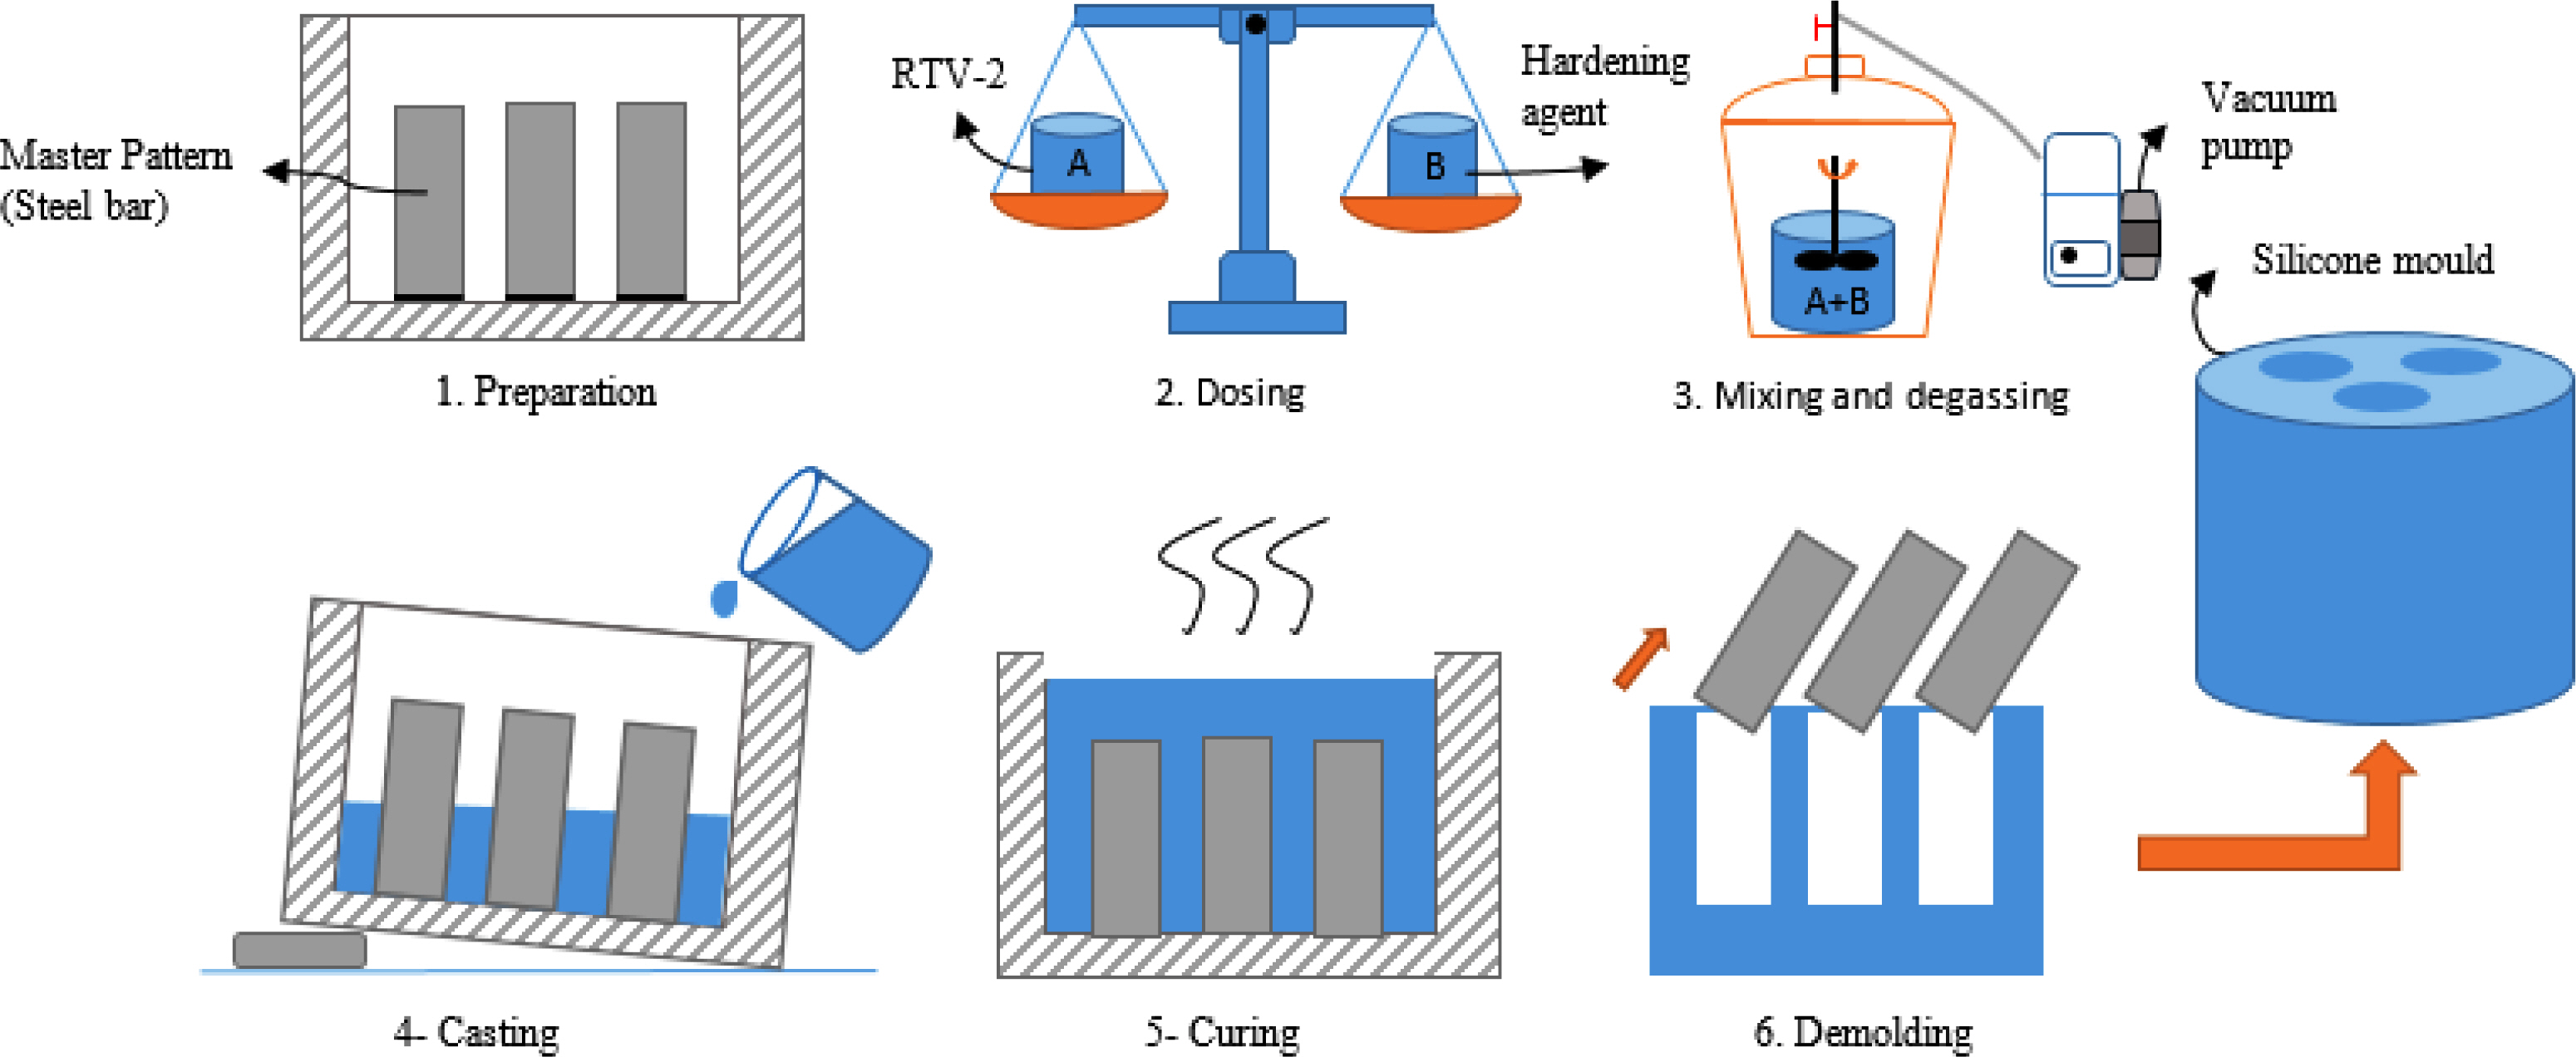
Production of Silicon Mold and Reinforced PU Test Samples. The silicone mold was prepared first to produce the PU wear test specimens. During the silicone mold preparation phase, master steel samples (Ø10×25 mm) manufactured in the size of the wear-test samples were used. These samples adhered to the base surfaces of cylindrical containers, which were then filled with mold silicone. The material used was room-temperature vulcanizing (RTV-2) silicon with a Shore A hardness value of 20. During the silicone preparation process, the mold silicone was mixed with the hardening agent and kept under vacuum for 10 min. The silicone mixture was poured into the prepared cylindrical containers over the cylindrical samples adhered to the base surface, and then kept under vacuum for 20-25 min, thus preventing the formation of air bubbles on the surfaces of the test samples. After degassing, the whole structure was kept in an oven at 40-45 °C for 12 h to achieve better dimensional accuracy.18 The steel samples were removed from the silicone mold that had been cured in the oven, making it ready for casting. The silicon molding process is shown schematically in Figure 1.
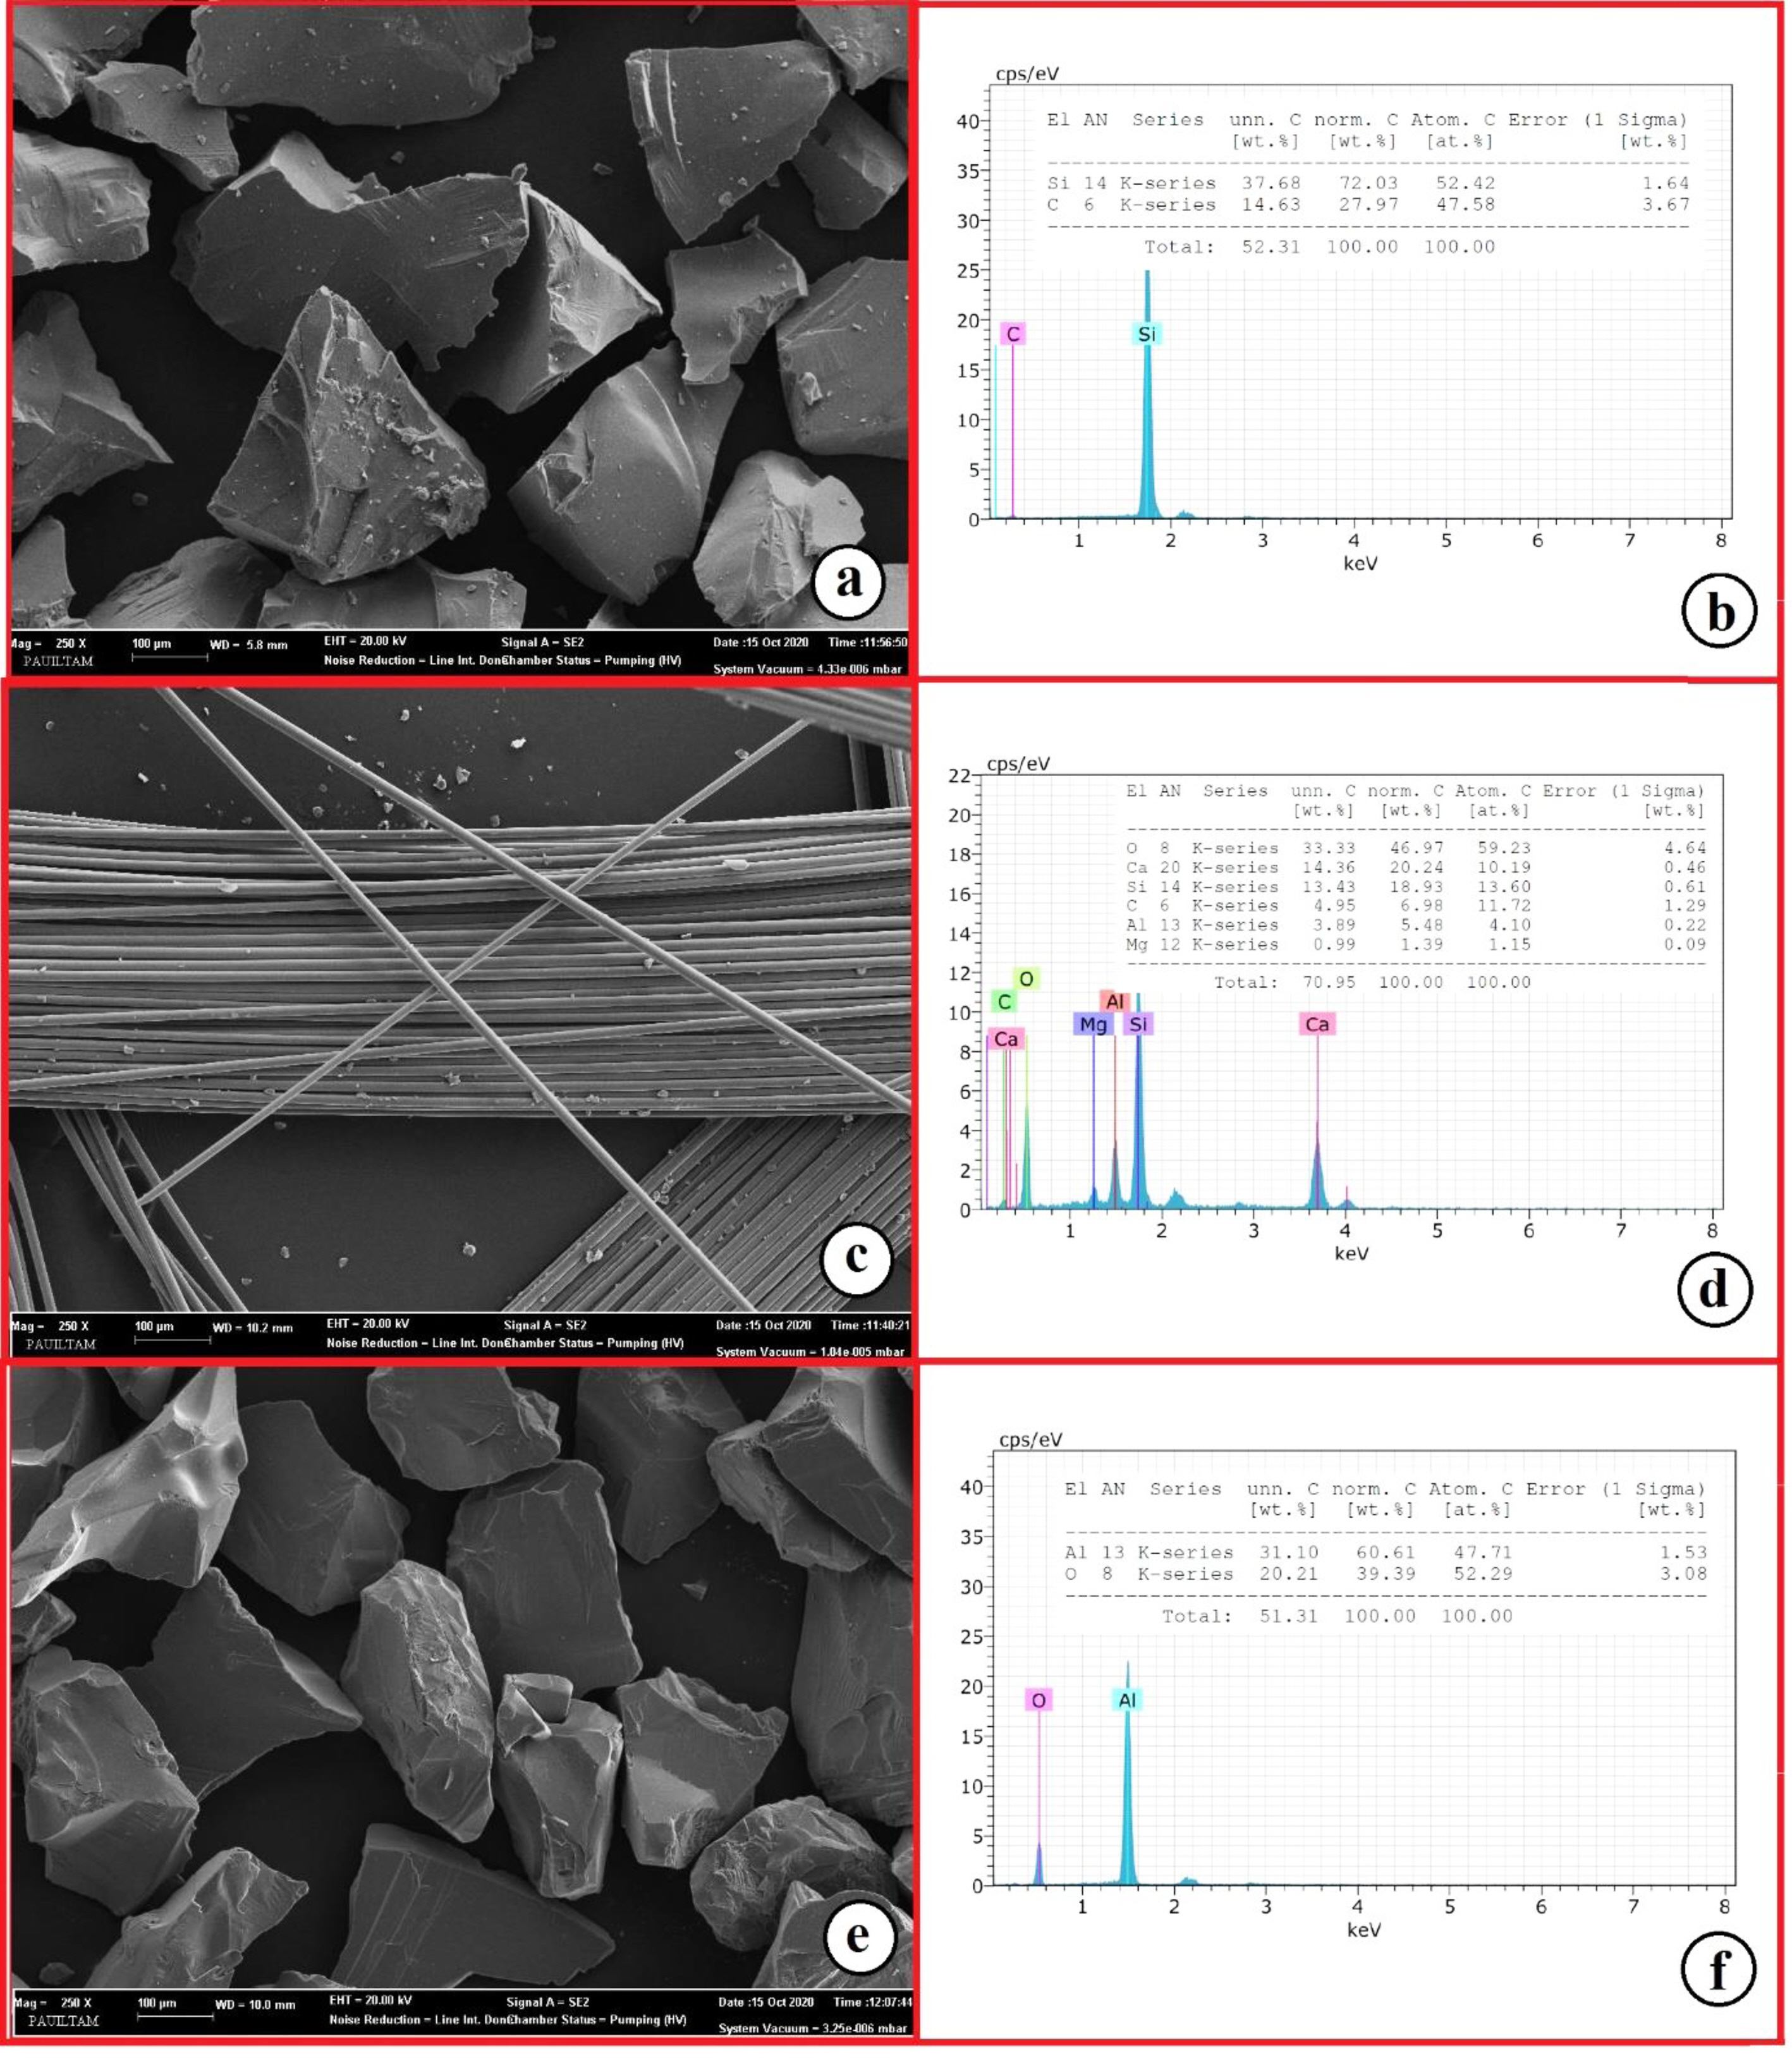
The polyurethane matrix material used in the experiments consisted of polyol and isocyanate compounds in a ratio of one-to-one by weight. The chopped GF, SiC, and Al2O3 were added to the PU test samples to be produced by vacuum silicon casting. Figure 2 presents SEM images of the reinforcement materials. The reinforcement materials were added to the matrix material at 7.5, 15, 22.5, and 30% by weight. Due to the very short curing time after mixing the polyol and isocyanate, the reinforcement materials were first combined with the isocyanate. The reinforcement materials along with the isocyanate were mixed in a mechanical mixer at 180 rpm for 3 min. Later, the polyol was added to the isocyanate-reinforcing material mixture and mixed at 180 rpm for an additional 3 min. The mixture was poured into the silicone mold and allowed to cure under vacuum for 30 min. Finally, the cured test specimens were removed from the silicone mold and made ready for the abrasion test. The production of the reinforced PU test samples is shown in Figure 3.
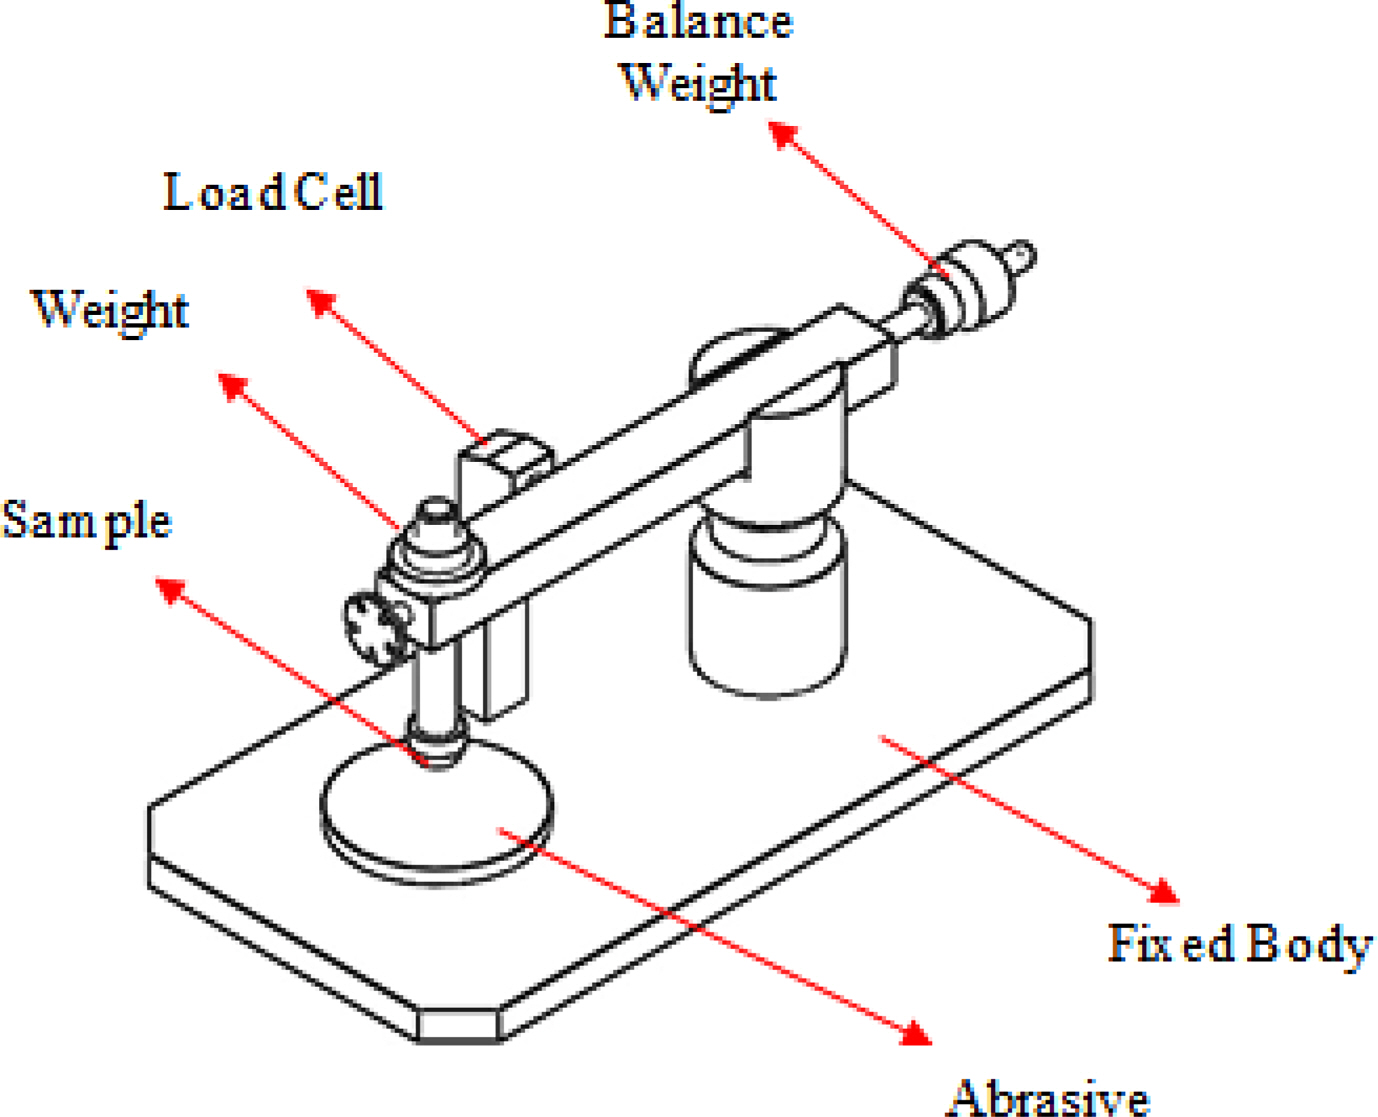
Pin-on-disc Wear Tests. The wear tests were carried out in accordance with ASTM standard G99 using a pin-on-disk apparatus under dry test conditions. A PU sample of Ø10×25 mm in diameter was used as the pin and 200-grit abrasive paper was used with an abrasive disc as the counter-face during the wear test. The wear test was carried out at a constant sliding distance of 100 m under two different loads of 5 and 10 N at a speed of 1.2 m/s. The pin-on-disk test apparatus is shown in Figure 4.19
The applied load on the specimen was recorded during the wear test for the calculation of the friction coefficient (CoF), which was found by using eq. (1).19
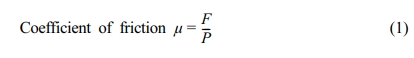
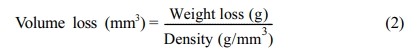
The frictional force and the normal load on the specimen are symbolized by F and P, respectively. Eq. (2) expresses the calculation of the volume loss by using the weight loss.
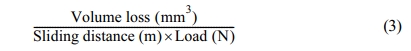
Eq. (3) was used to define the specific wear rate (SWR).
|
Figure 1 Silicone mold production stages. |
|
Figure 2 Reinforcement materials used in PU composites: (a-b) SiC; (c-d) GF; (e-f) Al2O3 |

|
Figure 3 Production of reinforced PU materials. |
|
Figure 4 Schematic view of pin-on-disc test apparatus. |
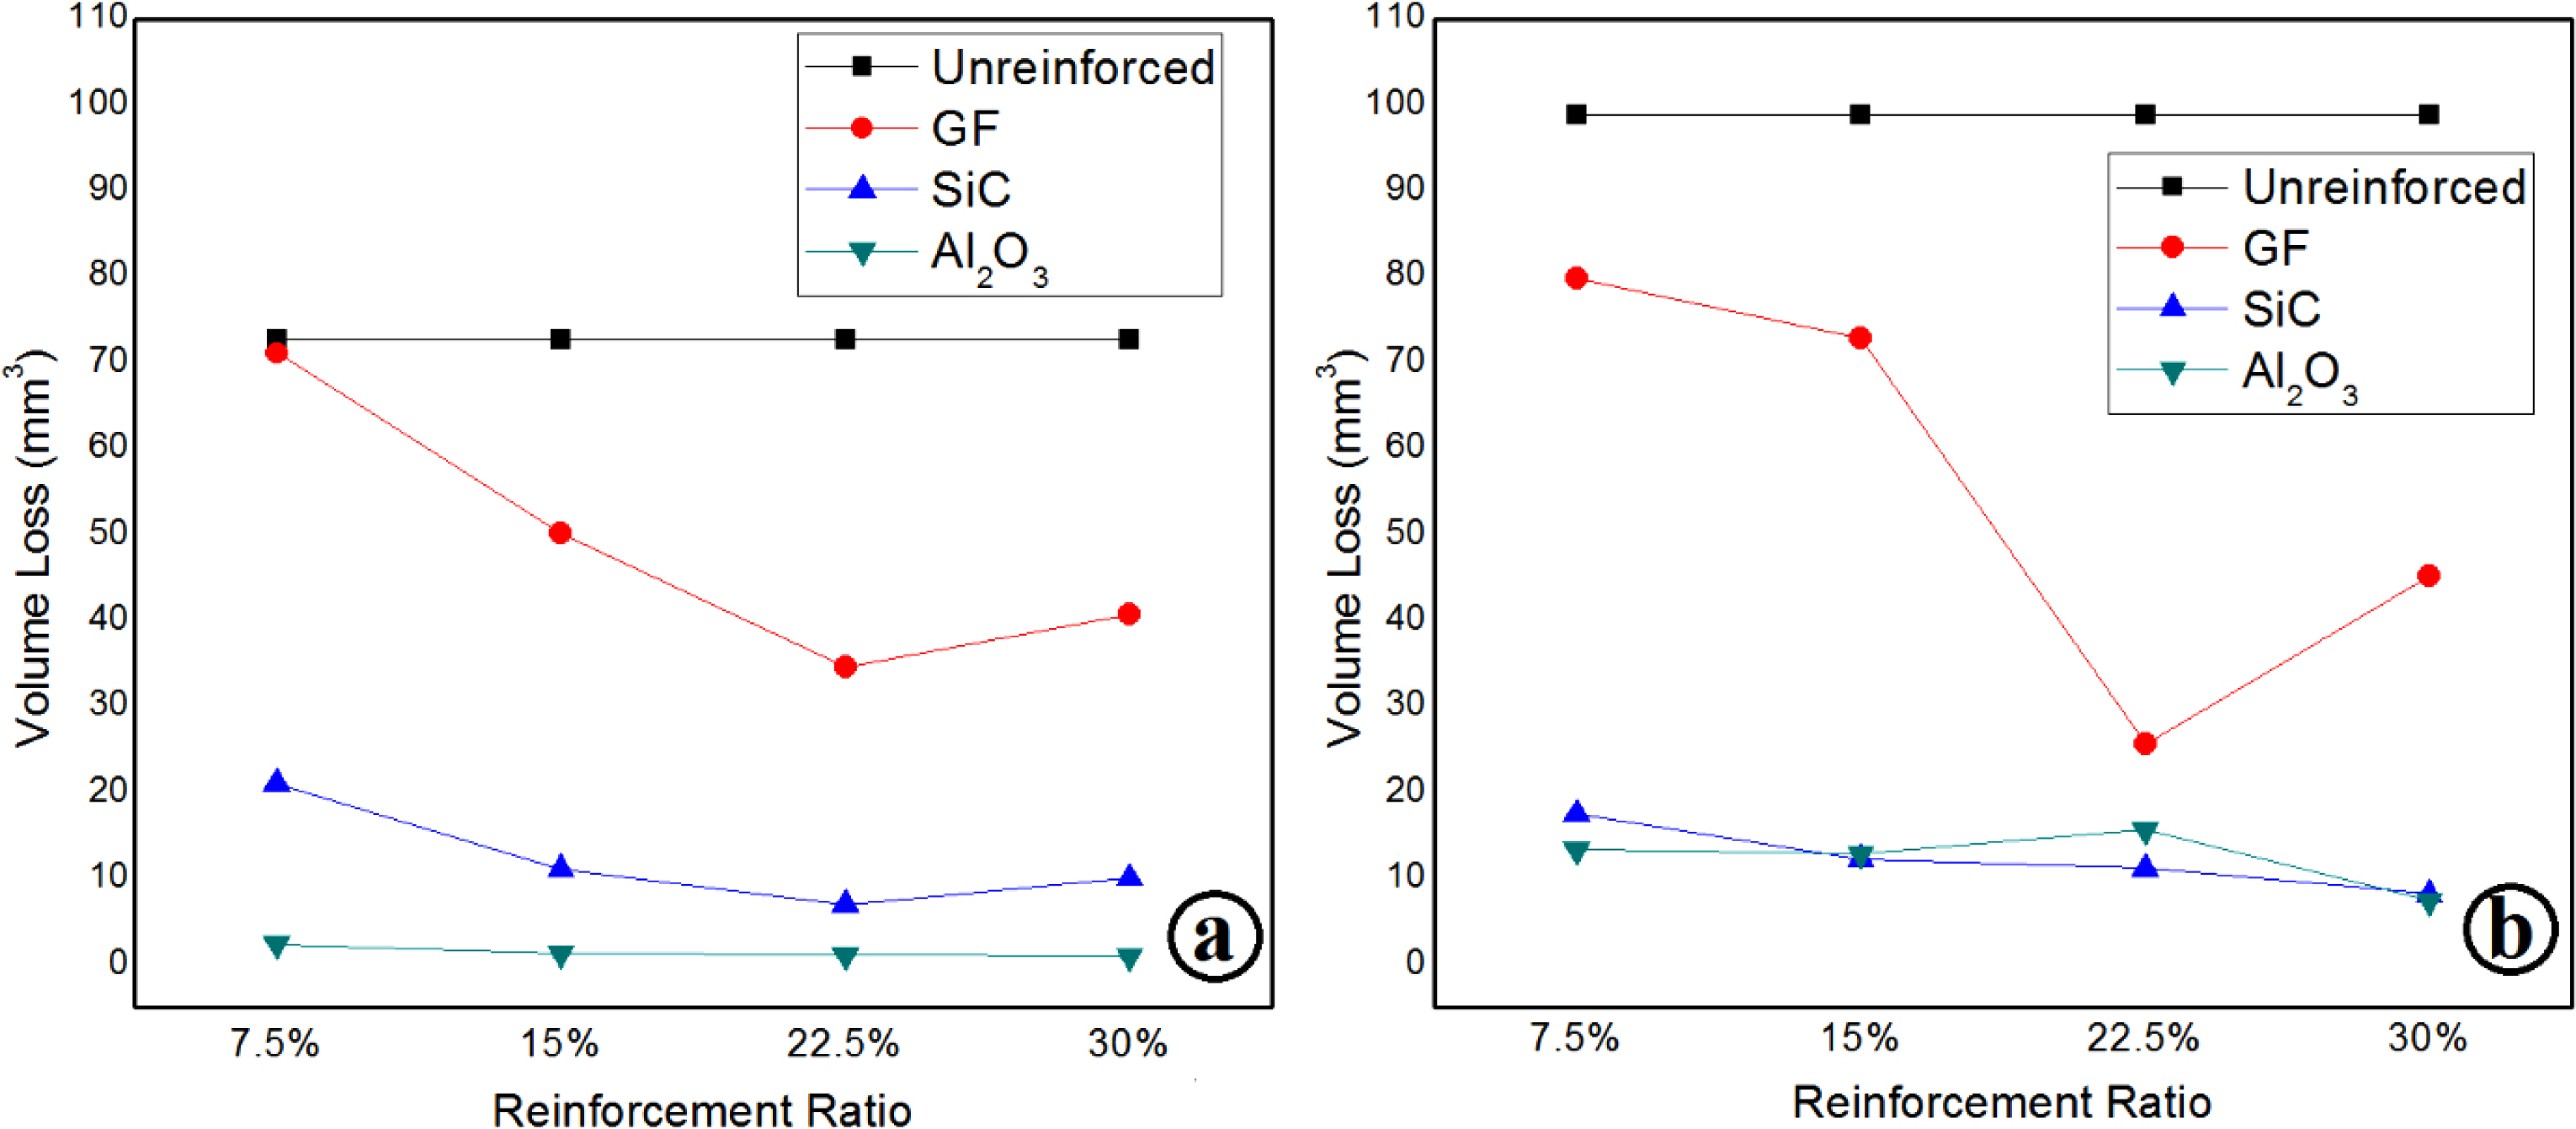
The effect of the reinforcement ratio on volume loss for different loads of 5 and 10 N is shown in Figure 5(a) and (b), respectively. Under the 5 N load, the wear volume decreased with up to 22.5% reinforcement. However, volume loss increased slightly for all reinforcement materials at 30% in the PU composites. Because PU is a soft thermoplastic and GF, SiC, and Al2O3 are hard materials, the main matrix reached saturation when the reinforcement ratio was increased to 30%. The excessive increase of hard materials in the soft thermoplastic matrix increased the wear rate of the thermoplastic composites.20-25 The volume loss of the reinforced PU at 10 N was similar to that at 5 N. The lowest volume loss was obtained with the Al2O3-reinforced PU specimen, with the SiC specimen in second place. The GF also exhibited better performance than the unreinforced PU in the abrasive wear tests. Moreover, the results revealed that particle reinforcement played a more effective role in wear resistance than fiber reinforcement. Due to the chemical and physical properties of the reinforcement materials, the adhesion properties to the polymer matrix during casting and curing would be different.26-28 Although GF exhibits much better wear resistance than unreinforced PU, it is spalling during wear experiments. These chemical reactions affect volume loss and wear rate negatively for GF reinforcement. Particle-reinforcements adhered better to the polymer matrix and increased the wear resistance of PU. Consequently, because the SiC and Al2O3 adhered to the PU matrix better than the GF, this led to increasing friction and therefore, the GF had a lower volume loss than SiC and Al2O3 reinforcements.
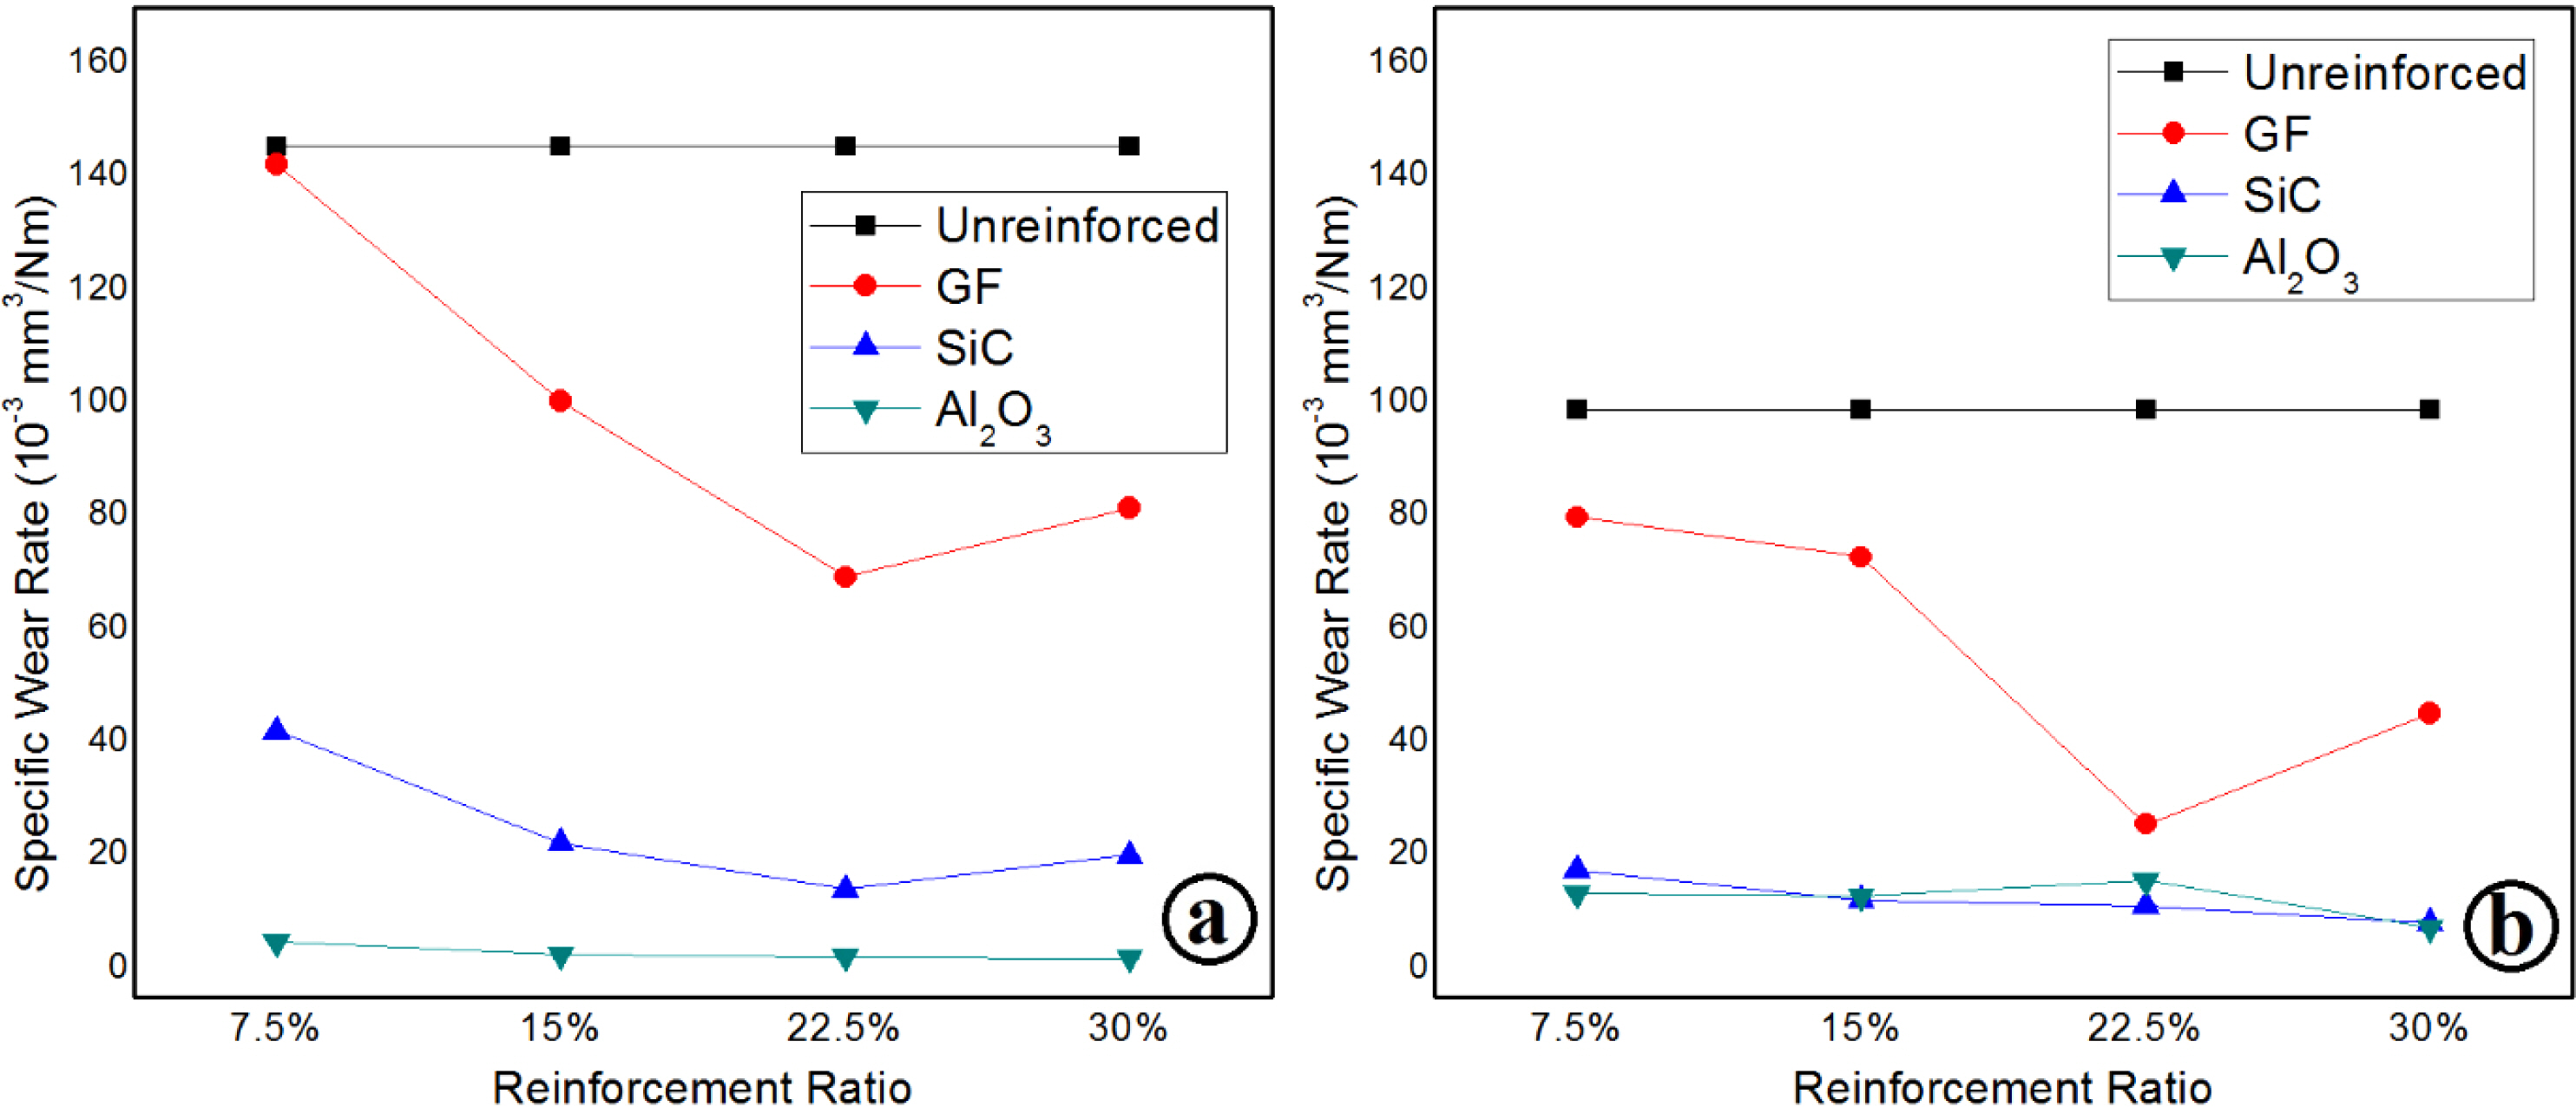
The SWR for the PU composites is given in Figure 6(a) and 6(b) for 5 and 10 N loads, respectively. The SWR shows the relationship between applied load and volume loss.25 Moreover, the SWR for all PU samples was mostly high for the 5 N load and low for the 10 N load. This can be explained by the fact that more reinforcement material was exposed to the wear process at the higher load.
Due to their high hardness values, these exposed reinforcement materials provided improved wear resistance. In addition, they also provided more resistance to damage of the PU matrix tribological systems. Thus, material loss rate decreased according to the applied load. It can also be noted that, similar to the volume loss findings, the SWR usually decreased with increases in the reinforcement ratio of up to 22.5% in the PU matrix. These results indicated that reinforcement addition plays an essential role in the tribological systems.
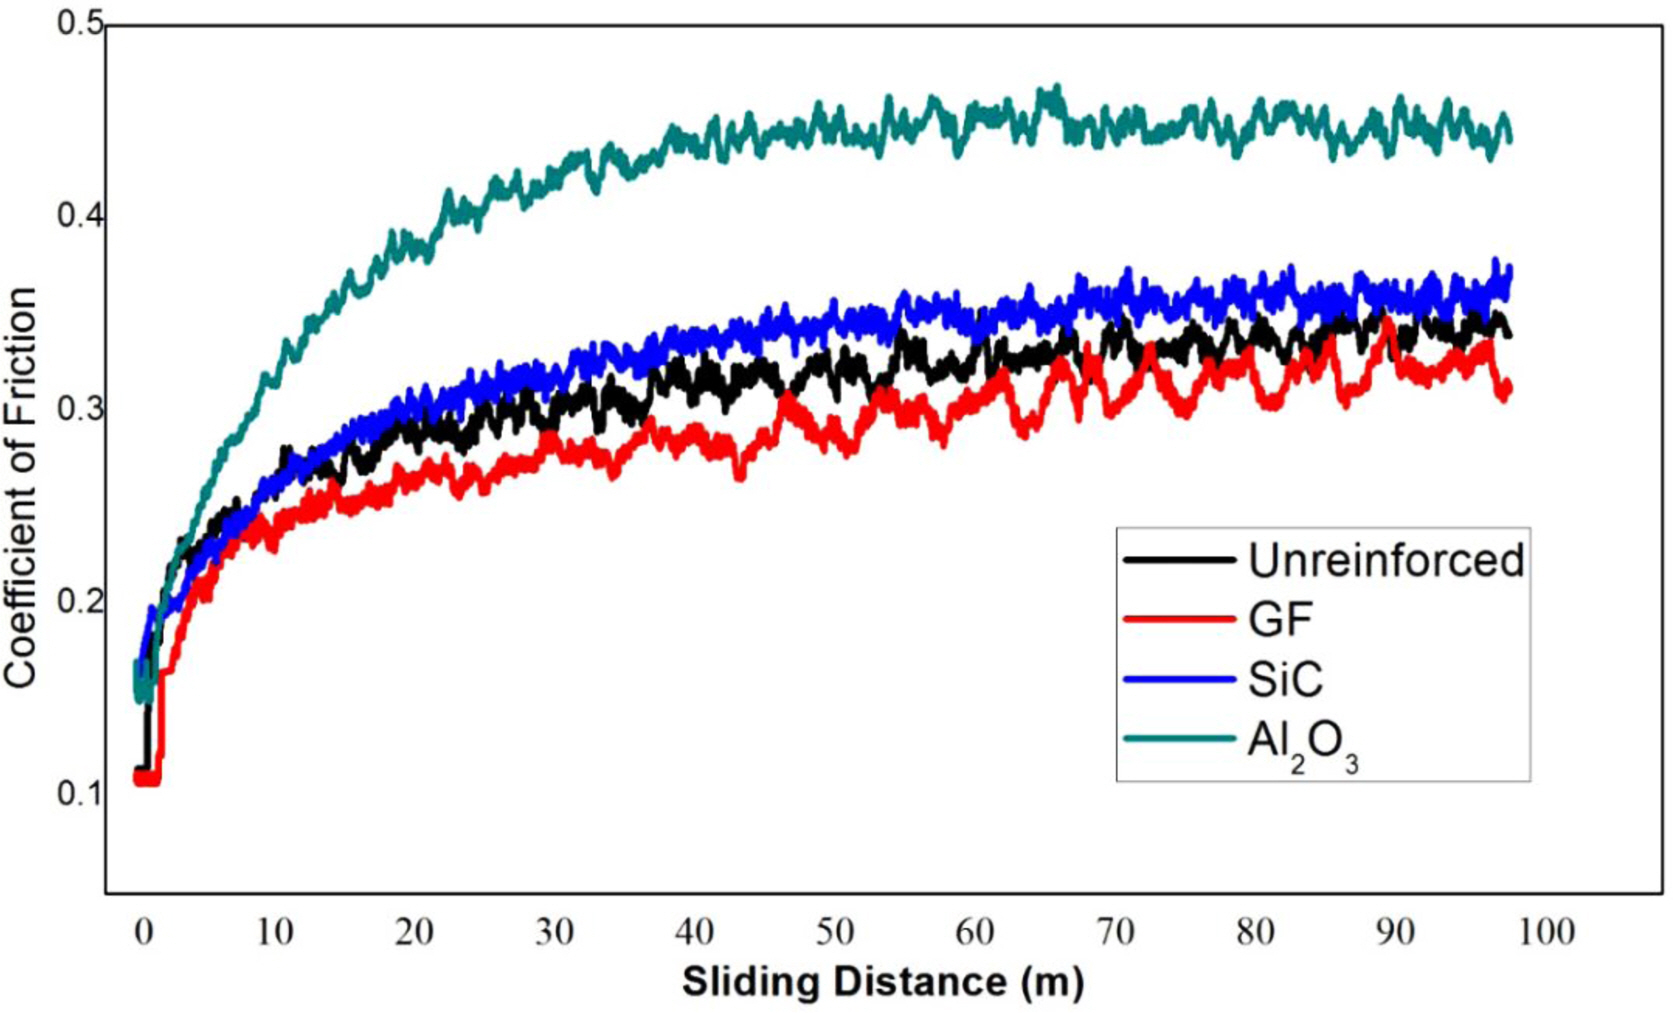
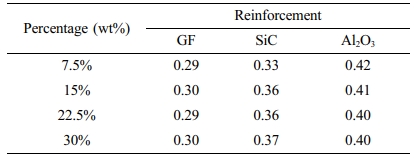
The CoF change according to the sliding distance under a constant load and reinforcement rate for the unreinforced, GF-, SiC- and Al2O3-filled PU is given in Figure 7. In addition, Table 1 gives the average CoF values of the PU composites for all test specimens. The CoF curve was typically flat and smooth for all PU samples. The average CoF of the unreinforced PU was 0.31. This value was higher than that of the GF-reinforced PU and lower than that of the SiC and Al2O3 reinforced PU for all reinforcement percentages. The GF demonstrated a self-lubricating effect on the contact surface between the specimen and the abrasive. The SiC and Al2O3 particle-reinforced PU composites exhibited higher friction coefficients. The highest CoF was obtained in the Al2O3-reinforced PU under all test conditions. The Al2O3 reinforcement also provided the lowest volume loss, as mentioned earlier. The Al2O3, composed of hard particles, led to increasing wear resistance; however, it also made friction difficult on the contact surface. Because the Al2O3 adhered to the PU matrix better than the SiC, this led to increasing friction and therefore, the Al2O3 had a higher CoF than the SiC reinforcement. During wear tests, the major wearing part is the soft PU matrix. Reinforcement materials are exposed to much less wear thanks to their high hardness. Even at the lowest reinforcement ratio, the contact of the reinforcement elements on the surface determines the friction coefficient. In other words, even if the reinforcement ratio increases, the coefficient of friction is related to the friction coefficient of the reinforcement material. That’s why the average CoF of GF-, SiC- and Al2O3-filled PU was unchanged according to the increase of fillers content in Table 1.
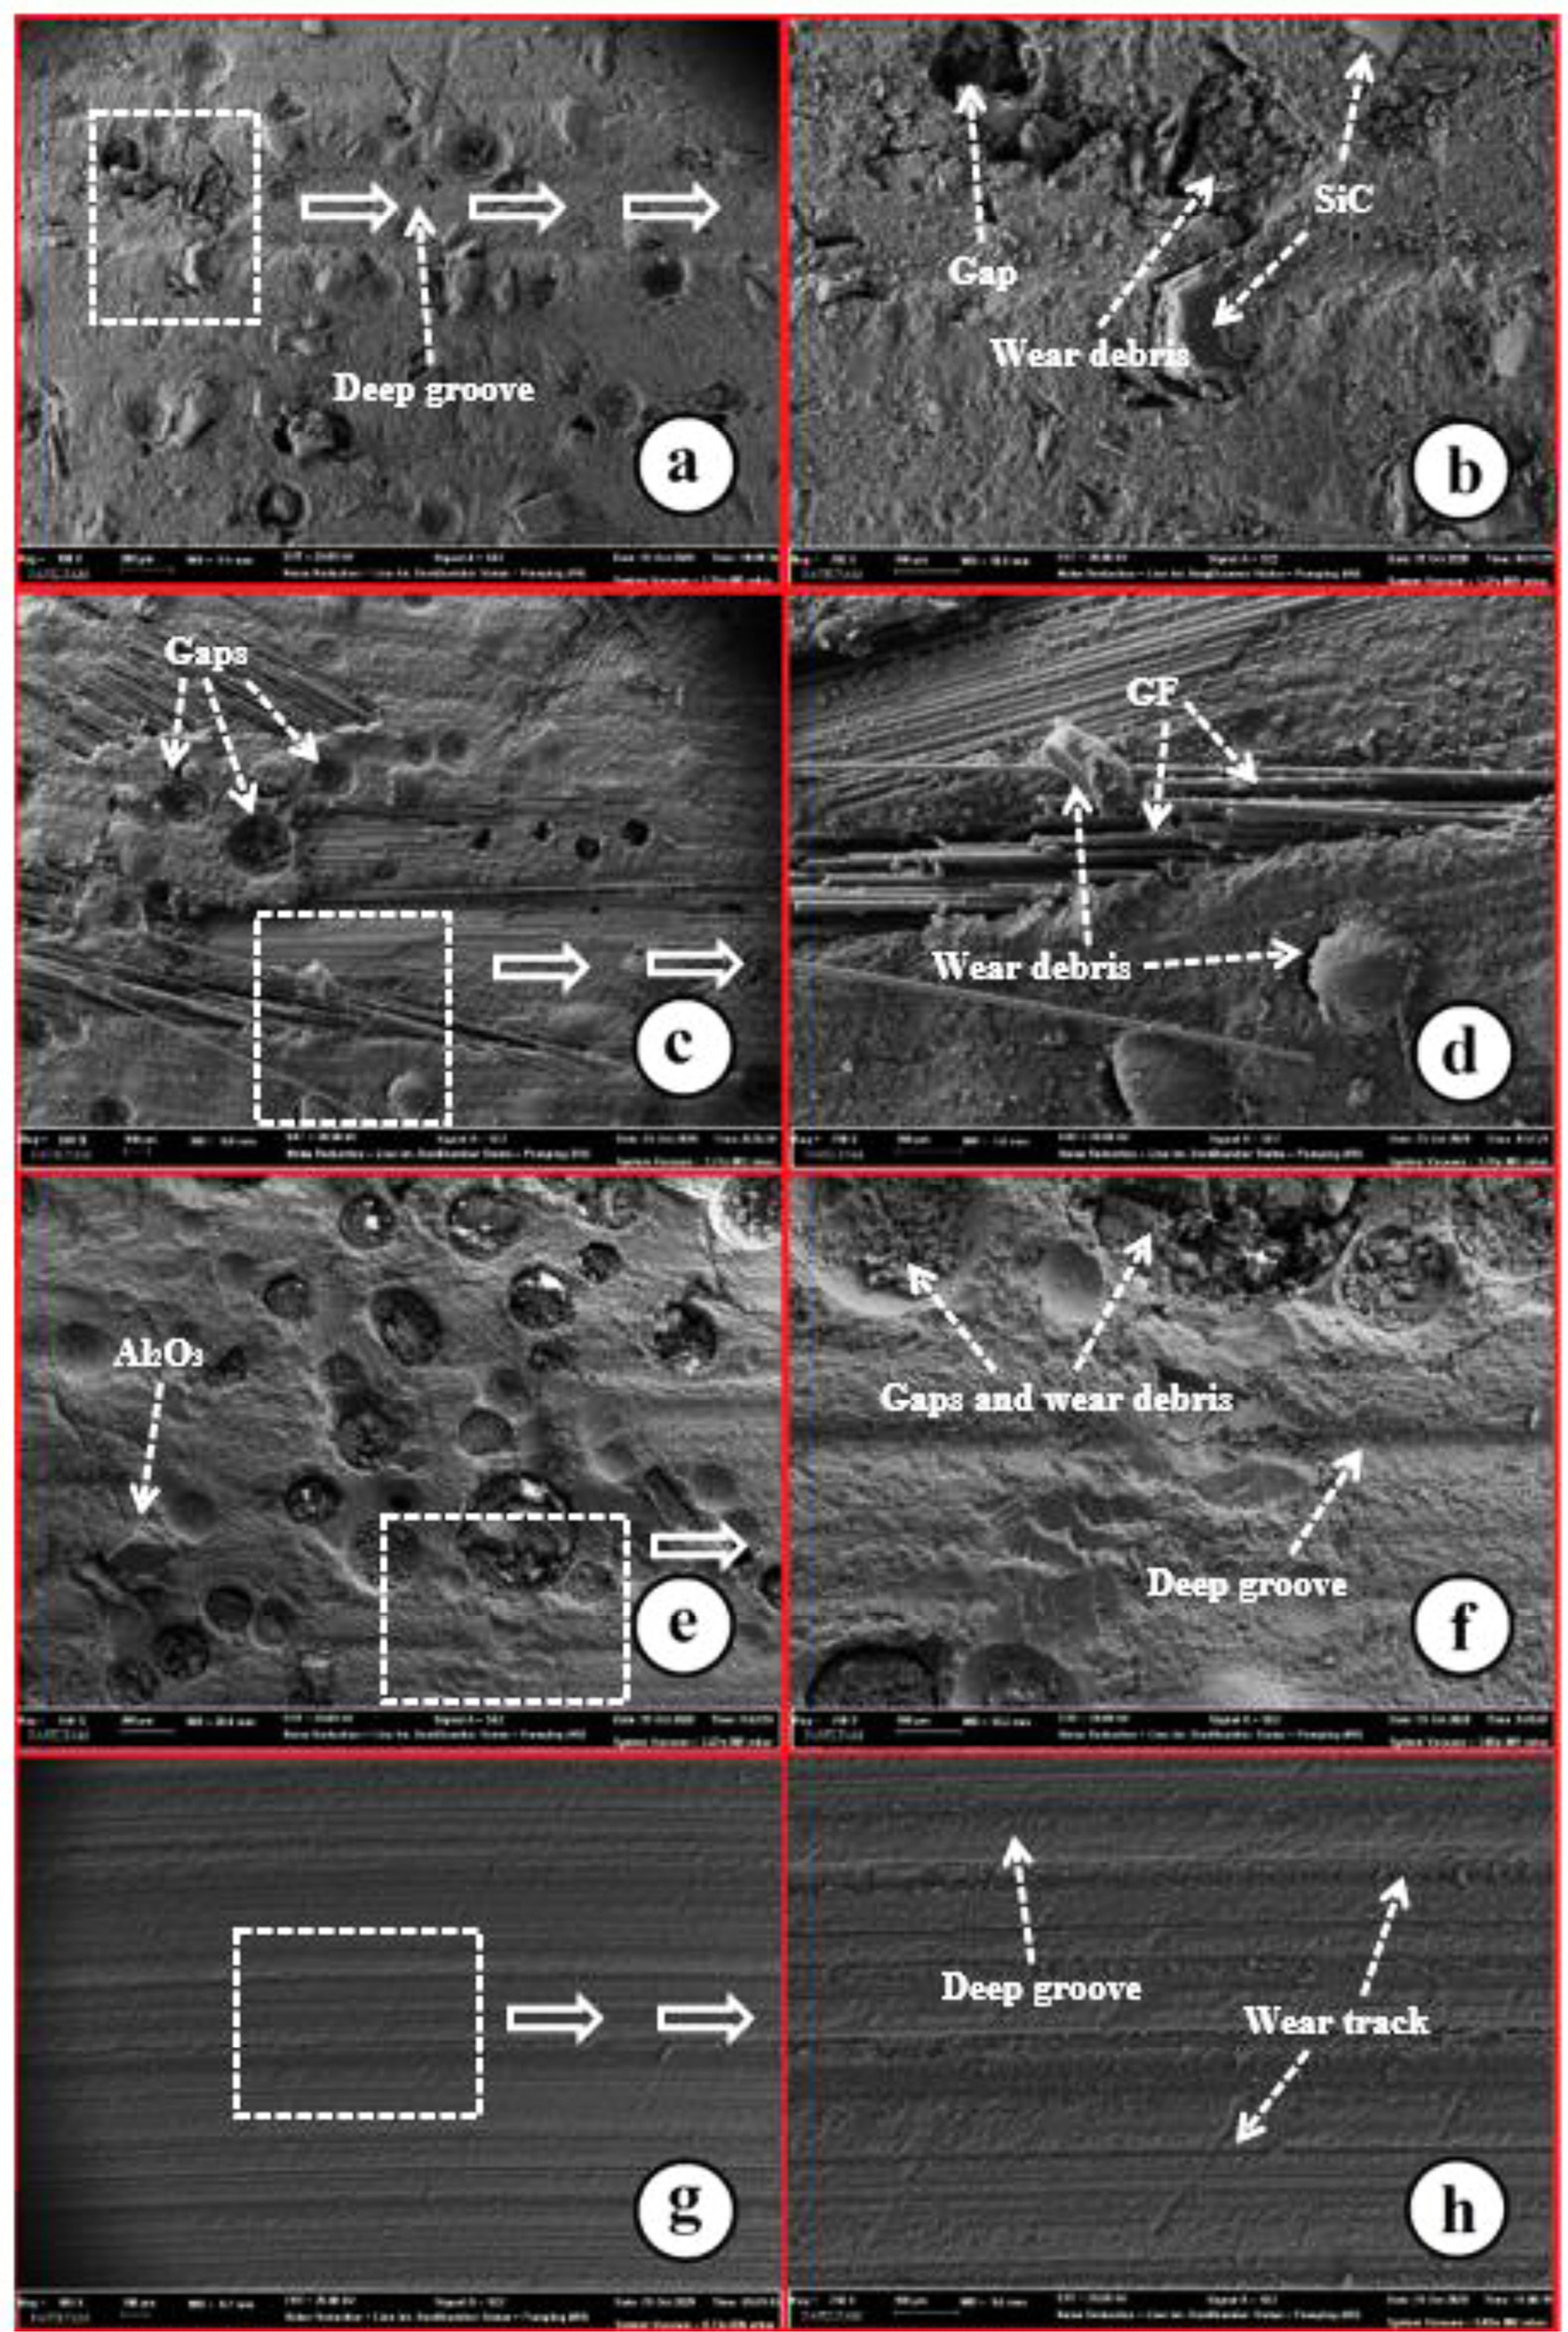
Figure 8 shows SEM images of the worn surfaces of unreinforced PU and PU composites reinforced with SiC, GF, and Al2O3 at 30 wt% content. As seen in Figure 8(g)-(h), the worn surface of unfilled PU is smoother than that of the filled PU composites. However, gaps are seen on the worn surfaces of the reinforced PU composites (Figure 8(a)-(f)). Some of the gaps are air gaps that occurred because of the reinforcement materials during production. Some of them are gaps caused by the abrasive surface during wear tests. Although the production was carried out under vacuum, air gaps could have occurred between the reinforcement materials and the PU matrix.
The worn surfaces of the SiC-, GF-, and Al2O3-filled PU exhibited exposed fillers, gaps, and wear debris and grooves caused by the peeling of the PU matrix. The fillers exposed to the counter-face by the expanded gaps were ultimately removed, as shown in Figure 8(a)-(f). The exposed fillers acted as hard particles and reduced the counter-face contact area; thus, the volume loss of the filled PU was significantly decreased. In addition, the exposed GF led to the reduction of the contact area and the CoF, contrary to what was seen in the particle-reinforced PU composites. Moreover, the sloughed GFs also acted as needle roller bearings that further reduced the volume loss. The experiments indicated that the usage of reinforcement materials had improved the mechanical properties of materials produced from PU.26-30
|
Figure 5 Variation of volume loss during wear tests: (a) 5 N applied; (b) 10 N applied. |
|
Figure 6 SWR of PU composites: (a) 5 N applied; (b) 10 N applied. |
|
Figure 7 CoF of 7.5%-reinforced PU composites. |
|
Figure 8 SEM images of worn PU composite surfaces: (a-b) SiCreinforced; (c-d) GF-reinforced; (e-f) Al2O3-reinforced; (g-h) unreinforced. |
In this paper, PU composites reinforced with GF, Al2O3, and SiC were fabricated and the effects of the filler materials on the tribological properties were investigated.
Wear experiments clearly demonstrated that the reinforcement materials reduced the volume loss and SWR significantly. Therefore, the GF, Al2O3, and SiC fillers improved the wear resistance of the PU. No significant difference in effect was found between the Al2O3 and SiC reinforcements, although the GF-filled PU provided a lower CoF than the unreinforced PU. The GF exhibited a self-lubricating effect on the contact surface between the specimen and the abrasive. The SiC and Al2O3 particle-reinforced PU composites exhibited higher CoF values. The highest CoF was obtained in the Al2O3-reinforced PU under all test conditions. The worn surfaces of the SiC-, GF- and Al2O3-filled PU displayed exposed fillers, gaps, and wear debris and grooves caused by the peeling of the PU matrix. Where the gaps had expanded, the fillers exposed to the counter-face were ultimately removed. The exposed fillers acted as hard particles and reduced the counter-face contact area; thus, the volume loss of the filled PU was significantly reduced.
- 1. Zmarzły, P.; Gogolewski, D.; Kozior, T. Design Guidelines for Plastic Casting Using 3D Printing. J. Eng. Fiber. and Fabr. 2020, 15, 1-10.
-

- 2. Denoual, M.; Macé, Y.; Le Pioufle, B.; Mognol, P.; Castel, D.; Gidrol, X. Vacuum Casting to Manufacture a Plastic Biochip for Highly Parallel Cell Transfection. Meas. Sci. Technol. 2006, 17, 3134-3140.
-
- 3. Chua, C. K.; Chew, T. H.; Eu, K. H. Integrating Rapid Prototyping and Tooling with Vacuum Casting for Connectors. Int. J. of Adv. Manuf. Technol. 1998, 14, 617-623.
-
- 4. Wortmann, M.; Hoffmann, A.; Frese, N.; Heidi, A.; Brikmann, J.; Brandt, N.; Menzel, M.; Gölzhäuser, A.; Moritzer, E.; Hüsgen, B. Advanced Output of Silicone Molds in Vacuum Casting Processes by Polyamide 12 Powder Supplementation. Polym. Technol. Mater. 2019, 58, 1937-1943.
-
- 5. Jiang, J.; Hu, G.; Li, X.; Xu, X.; Zheng, P.; Stringer, J. Analysis and Prediction of Printable Bridge Length in Fused Deposition Modelling Based on Back Propagation Neural Network. Virtual Phys. Prototyp. 2019, 14, 253-266.
-
- 6. Wortmann, M.; Frese, N.; Keil, W.; Brikmann, J.; Biedinger, J.; Brockhagen, B.; Reiss, G.; Schmidt, C.; Gölzhäuser, A.; Moritzer, E.; Hüsgen, B. The Deterioration Mechanism of Silicone Molds in Polyurethane Vacuum Casting. ACS Appl. Polym. Mater. 2020, 2, 4719-4732.
-
- 7. Budzik, G. Possibilities of Using Vacuum Casting Process for Manufacturing Cast Models of Turbocharger Impellers. J. Kones. 2007, 14, 125-130.
- 8. Thian, S. C. H.; Fuh, J. Y. H.; Wong, Y. S.; Loh, H. T.; Gian, P. W.; Tang, Y. Fabrication of Microfluidic Channel Utilizing Silicone Rubber with Vacuum Casting. Microsyst. Technol. 2008, 14, 1125-1135.
-
- 9. Liu, Y.; Kumar, S. Recent Progress in Fabrication, Structure, and Properties of Carbon Fibers. Polym. Rev. 2012, 52, 234-258.
-
- 10. Karsli, N. G.; Aytac, A. Tensile and Thermomechanical Properties of Short Carbon Fiber Reinforced Polyamide 6 Composites. Compos. Part B: Eng. 2013, 51, 270-275.
-
- 11. Elkazaz, E.; Crosby, W. A.; Ollick, A. M.; Elhadary, M. Effect of Fiber Volume Fraction on the Mechanical Properties of Randomly Oriented Glass Fiber Reinforced Polyurethane Elastomer with Crosshead Speeds. Alexandria Engin. J. 2020, 59, 209-216.
-
- 12. Reis, J. M. L.; Chaves, F. L.; da Costa Mattos, H. S. Tensile Behaviour of Glass Fibre Reinforced Polyurethane at Different Strain Rates. Mater. Des. 2013, 49, 192-196.
-
- 13. Zhang, H.; Li, W.; Yang, X.; Lu, L.; Wang, X.; Sun, X.; Zhang, Y. Development of Polyurethane Elastomer Composite Materials by Addition of Milled Fiberglass with Coupling Agent. Mater. Lett. 2007, 61, 1358-1362.
-
- 14. Akram, N.; Saeed, M., Usman, M.; Mansha, A.; Anjum, F.; Mahmood Zia, K.; Mahmood, I.; Mumtaz, N.; Khan, W. G. Influence of Graphene Oxide Contents on Mechanical Behavior of Polyurethane Composites Fabricated with Different Diisocyanates. Polymers 2021, 13, 444-460.
-
- 15. Yang, X.; Shuai, C. G.; Chen, L. G.; Yang, S. L. Study on Creep Property of Polyurethane Composites. Mater. Res. Innov. 2015, 5199-5201.
-
- 16. Heck, C. A.; Giacomolli, D. A.; Livotto, P. R.; dos Santos, J. H. Z; Wolf, C. R. Hybrid Silica Generated In Situ in Polyurethane-based Composites. J. Appl. Polym. Sci. 2014, 131.
-
- 17. Liu, L.; Zhou, Y.; Pan, S. Experimental and Analysis of the Mechanical Behaviors of Multi-walled Nanotubes/polyurethane Nanoweb-reinforced Epoxy Composites. J. Reinf. Plast. Comp. 2013, 32, 823-834.
-
- 18. Tang, Y.; Tan, W. K.; Fuh, J. Y. H.; Loh, H. T.; Wong, Y. S.; Thian, S. C. H.; Lu, L. Micro-mould Fabrication for a Micro-gear via Vacuum Casting. J. Mater. Process. Technol. 2007, 192, 334-339.
-
- 19. Kaplan, Y. Role of Reinforcement Materials on Mechanical and Tribological Properties of PTFE Composites. Polym. Korea 2020, 44, 436-444.
-
- 20. Suresha, B.; Chandramohan, G.; Dayananda J. N.; Siddaramaiah. Effect of Short Glass Fiber Content on Three-body Abrasive Wear Behaviour of Polyurethane Composites. J. Compos. Mater. 2007, 41, 2701-2713.
-
- 21. Yu, P.; Li, G.; Zhang, L.; Zhao, F.; Guo, Y.; Pei, X. Q.; Zhang, G. Role of SiC Submicron-particles On Tribofilm Growth at Water-lubricated Interface of Polyurethane/epoxy Interpenetrating Network (PU/EP IPN) Composites and Steel. Tribol. Int. 2021, 153.
-
- 22. Fu, S. Y.; Feng, X. Q.; Lauke, B.; Mai, Y. W. Effects of Particle Size, Particle/matrix Interface Adhesion and Particle Loading on Mechanical Properties of Particulate-polymer Composites. Compos. Part B: Eng. 2008, 39, 933-961.
-
- 23. Uhm, Y. R.; Kim, J.; Son, K. J.; Kim, C. S. Effect of Particle Size, Dispersion, and Particle-matrix Adhesion on W Reinforced Polymer Composites. Res. on Chem. Intermediat 2014, 40, 2145-2153.
-
- 24. Shang, S. W.; Williams, J. W.; Söderholm, K. J. M. Work of Adhesion Influence on the Rheological Properties of Silica Filled Polymer Composites. J. Matter. Sci. 1995, 30, 4323-4334.
-
- 25. Busse, M.; Schlarb, A. K. A Novel Neural Network Approach for Modeling Tribological Properties of Polyphenylene Sulfide Rein- forced on Different Scales. In Tribology of Polymeric Nano- composites; Friedrich, K.; Schlarb, A. K., Eds.; Butterworth-Heinemann: Germany, 2013; pp 779-793.
-
- 26. Zhang, Z.; Yang, M.; Yuan, J.; Guo, F.; Men, X. Friction and Wear Behaviors of MoS2-multi-walled-carbonnanotube Hybrid Reinforced Polyurethane Composite Coating. Friction 2019, 7, 316–326.
-
- 27. Jeevanantham, R.; Venketaramanamurthy, V. P.; Rajeswari, D. Mechanical and Wear Characterization of Basalt Fiber Reinforced Polyurethane Composites. Int. J. Adv. Eng. & Tech. 2016, 9, 79-83.
- 28. He, T.; Wang, G.; Wang, Y.; Liu, Y.; Lai, W.; Wang, X. Feng, Y., Liu, X. Simultaneously Enhancing of Wear-resistant and Mechanical Properties of Polyurethane Composite Based on the Selective Interaction of Fluorinated Graphene Derivatives. Compos. Part B: Eng. 2019, 169, 200-208.
-
- 29. Choi, E. Y.; Kim, S. W.; Lee, J. Y.; Ha, J. H.; Kim, C. K. Characteristics of Polyurethane Composites Containing Poly- urethane Grafted Multi-walled Carbon Nanotubes. Polym. Korea 2017, 41, 490-494.
-
- 30. Kim, Y.; Yoon, H. J.; Lee, S. Y.; Lee, J. H.; Moon, S. B.; Nam, J. M.; Jung, K.; Wie, J. J. Analysis of Mechanical Properties in Thermoplastic Polyurethane-microcrystalline Cellulose Composites. Polym. Korea 2020, 44, 776-783.
-
- Polymer(Korea) 폴리머
- Frequency : Bimonthly(odd)
ISSN 0379-153X(Print)
ISSN 2234-8077(Online)
Abbr. Polym. Korea - 2023 Impact Factor : 0.4
- Indexed in SCIE
 This Article
-
2021; 45(6): 824-831
Published online Nov 25, 2021
- 10.7317/pk.2021.45.6.824
- Received on Mar 4, 2021
- Revised on Aug 26, 2021
- Accepted on Sep 11, 2021
Services
Shared
Correspondence to
- Yavuz Kaplan
-
Mechanical Engineering, Faculty of Technology, Pamukkale University, Denizli 20160, Turkey
- E-mail: ykaplan@pau.edu.tr
- ORCID:
0000-0002-3144-9332
Hyecheon Building(Room 601), #354, Gangnam-Daero, Gangnam-Gu, Seoul 06242, Korea
TEL : 82-2-568-3860, 561-5203, 569-3860 FAX : 82-2553-6938 E-mail: polymer@polymer.or.kr