


- Chemotaxis Assay of RAW264.7 Cells Using a Simple Microfluidic Chip with Lipopolysaccharide Gradient
Hye-Won Kang*, **, Guk Young Ahn*, **, Inseong Choi*, **, and Sung-Wook Choi*, **,†

*Biomedical and Chemical Engineering, Department of Biotechnology, The Catholic University of Korea, 43 Jibong-ro, Wonmi-gu, Bucheon-si, Gyeonggi-do, 14662, Korea
**Department of Biotechnology, The Catholic University of Korea, 43 Jibong-ro,
Wonmi-gu, Bucheon-si, Gyeonggi-do, 14662, Korea- 리포다당류 구배 미세유체칩을 이용한 RAW264.7 세포의 주화성 분석
강혜원*, ** · 안국영*, ** · 최인성*, ** · 최성욱*, **,†
*가톨릭대학교 바이오메디컬화학공학과, **가톨릭대학교 생명공학과
Reproduction, stored in a retrieval system, or transmitted in any form of any part of this publication is permitted only by written permission from the Polymer Society of Korea.
A microfluidic chip with two inlets, a cell chamber, and one outlet was fabricated for chemotaxis analysis of cells. Aqueous phases with or without fluorescent dyes were separately injected into the cell chamber through inlets to confirm the concentration gradient. Profiles of the concentration gradient were simply controlled by changing the flow rate. RAW264.7, an immune cell, was selected as a model cell line to evaluate chemotaxis. Cell migration in the chamber was quantitatively analyzed over time by injecting an aqueous phase containing lipopolysaccharide into one inlet. It was found that RAW264.7 at a high lipopolysaccharide concentration migrated chaotically in all directions. However, RAW264.7 at a low lipopolysaccharide concentration migrated towards the higher lipopolysaccharide concentration at a velocity of 0.98 µm/h. Such concentration-gradient microfluidic chip fabricated in this study can be used as a platform to analyze the behavior of various cells in response to specific chemicals.
세포의 주화성 분석을 위하여 두 개의 주입구, 세포 챔버, 및 하나의 배출구를 갖는 미세유체칩을 제조하였다. 하나의 주입구에는 수상을, 다른 하나의 주입구에는 형광분자를 포함하는 수상을 주입하여 챔버 내에서의 농도 분극을 확인하였으며, 유속에 따라서 농도 분극 정도를 제어하였다. 리포다당류에 대한 세포의 주화성 평가를 위하여 면역세포인 RAW264.7를 선정하였다. 하나의 주입구에는 수상을, 다른 하나의 주입구에는 리포다당류를 포함한 수상을 주입하여, 시간에 따른 세포의 이동을 정량 분석하였다. 리포다당류의 농도가 높은 쪽의 RAW264.7는 모든 방향으로 무질서하게 이동하는 반면, 리포다당류의 농도가 낮은 쪽의 세포는 농도가 높은 쪽으로 0.98 μm/h의 속도로 방향성을 갖고 이동하였다. 본 연구에서 제조한 농도분극 미세유체칩은 다양한 세포의 특정 분자에 대한 거동을 분석하기 위한 플랫폼으로 활용될 수 있다.
A concentration-gradient microfluidic chip with a cell chamber was fabricated to analyze chemotaxis of RAW264.7 cells. Concentration gradient profiles were controlled by changing the flow rate. RAW264.7 cells rapidly migrated from the side with a low lipopolysaccharide concentration toward the side with a higher lipopolysaccharide concentration.
Keywords: lipopolysaccharide, microfluidic chip, immune cell, gradient, chemotaxis.
This study was supported by the National Research Foundation of Korea (NRF) grant funded by the Korean government (MIST) (No. 2021R1A2C1003865).
The authors declare that there is no conflict of interest.
Cells are directed by a variety of chemical signals (i.e., chemokine signaling). These chemical signals play an important role in inducing cell migration (i.e., chemotaxis) and regulating tissue homeostasis and inflammation.1 In particular, macrophages as immune cells with diverse functions in homeostatic and immune reactions can respond to a specific chemoattractant to detect and repair tissue damages, resolve infections, and maintain homeostasis.2,3 Consequently, there have been many studies on the behavior of cells in response to specific chemicals.
Various migration assays have been used to assess the behavior and migration of cells in response to different chemical signals.4-6 Among them, transwell assay is a technically simple and widely used method that can quantify cells migrated into a well through micrometer-sized pores under conditions of a concentration gradient by diffusion. Other methods such as Boyden chambers and Dunn chambers have also been proposed.7,8 Recently, the use of microfluidic systems to assess cell behavior and movement has been an active research topic. Microfluidic systems have the advantage of stable concentration gradient formation, evaluation of the behavior of different cell types, and real-time tracking of individual cells. Various fabrication methods for microfluidic systems have been proposed, including soft lithography, 3D printing, and laser patterning.9,10 Soft lithography has the advantage of precise channel control and multi-layer chip fabrication. However, the fabrication process is complex with a requirement of expensive equipment. Although 3D printing and laser patterning methods can easily fabricate microfluidic chips, they are limited by channel size and precision.9,11
Despite the numerous advantages of microfluidic systems, their practical application in biomedical research is hindered by several factors, including a lengthy fabrication process, challenges in controlling fluid flow, and issues associated with cell adhesion. Furthermore, chip design and its material should be capable of mass fabrication. For instance, a change from typical PDMS chips frequently used in academics to polystyrene injection molding or emerging 3D printing should be considered.12
In this study, we designed a straightforward microfluidic chip featuring two inlets, a cell chamber, and one outlet. We introduced a chemotaxis-inducing chemical through one inlet, establishing a concentration gradient of the chemical within the cell chamber. We then monitored behaviors of cells within the chamber over time, quantitatively assessing the angle and distance of their movement within this simple microfluidic chip. For this experiment, we chose RAW264.7 cell line and lipopolysaccharide as our model cell and chemoattractant, respectively, to evaluate chemotactic responses of cells to specific molecules.
Materials. All chemicals were obtained from Sigma-Aldrich and used as received unless otherwise specified. Poly (ε-caprolactone) (PCL, Mw=80000), chloroform (CF), and 2,2,2-trifluoroethanol (TFE) were used to make a T-shape pattern. Dichloromethane (DCM) served as an organic solvent to selectively remove the T-shape pattern. Lipopolysaccharides (LPS, from Escherichia coli O111:B4) served as an attractant of macrophage cells. Polydimethylsiloxane (PDMS) elastomer and curing agent (Sylgard® 184) were purchased from Sewang Hitech (Gimpo, Korea). Dulbecco’s Modified Eagle’s Medium (DMEM), phosphate-buffered saline (PBS), and fetal bovine serum (FBS) were purchased from Welgene (Gyeongsan, Korea). A green fluorescent dye (Bright Dyes® FLT Yellow/Green Liquid, Kingscote Chemicals, Ohio, USA) was used to observe concentration gradient in the cell chamber.
Preparation of Microfluidic Chip. A PCL pattern was printed on a slide glass using a 3D printer (EZ-robo GX, Iwashita Engineering Inc., Japan). The slide glass with a T-shaped PCL pattern was placed in a Petri dish and a PDMS mixture (PDMS elastomer and curing agent, 10:1 wt. ratio) was poured into the dish. After degassing, the PDMS on the T-shaped PCL pattern was placed in an oven at 60 ℃ for 5 h. The cured PDMS was immersed in DCM for 1 h to dissolve the PCL pattern. This one hour was the optimal time required for complete curing of PDMS at lower temperature conditions compared to conventional methods, allowing sufficient curing while preserving its structure. The obtained PDMS layer was dried at room temperature for DCM evaporation. No leakage of the solution was observed in the connection of a pipette tip onto a 1 mm thick PDMS substrate.13 After drying, the PDMS layer was cut into a size of a slide glass and inlet/outlet holes were developed by punching with a 17G needle. This needle size was suitable for efficient flow of cells and media. It was also easy to handle, offering flexibility in experimental set-up.14 A slide glass was subjected to O2 plasma treatment using an O2 plasma instrument (PDC-VCG2, Harrick Plasma, USA) for 1.5 min. The PDMS layer was adhered to the plasma-treated slide glass and then fixed with clamps. The inlet/outlet channels were connected to syringe pumps (KDS-100, KD Scientific Inc., Massachusetts, USA) using L-connectors (1/16 in. I.D.×3/32 in. O.D.) and Tygon® tubes (1/32 in. I.D.×3/32 in. O.D.).
Formation of Concentration Gradient. An aqueous solution with a green fluorescent dye was introduced into the microfluidic chip through one inlet in the half of the total flow rate. Total flow rates were varied at 0.2, 0.6, and 1.0 mL/h. Flow behaviors at the chamber were imaged using an optical microscope (BX-43, Olympus, Japan) and a fluorescence microscope (FM, IX71, OLYMPUS Co. Ltd., Tokyo, Japan). A fluorescent intensity profile was obtained from captured fluorescent images using ImageJ® software.
Cell Migration Analysis. NIH/3T3 fibroblasts and Mouse macrophage (RAW264.7) cells (Cell Line Bank, Seoul, Korea) were chosen as model cells to evaluate cell migration for chemotaxis. These cells were seeded into the cell chamber at a density of 1×10³ cells/chamber and incubated in a humidified atmosphere containing 5% CO2 at 37 ℃. The culture medium consisted of DMEM supplemented with heat-inactivated 10% FBS and 1% antibiotics (penicillin and streptomycin). After 24 h, the cell chamber was gently washed with PBS. Fresh DMEM, DMEM + 50% FBS (for NIH/3T3 fibroblast), or 50 µg/mL LPS (for RAW264.7) was then introduced into the cell chamber through each inlet at a total flow rate of 0.3 mL/h for 24 h. Cell migration rate in the chamber was determined as 12 frames/h using an optical microscope. Migration angle and distance were measured using ImageJ® software to obtain a Rose plot with circles. Cell migration velocity (Vtaxis) was calculated as the average of cell migration distance divided by time.
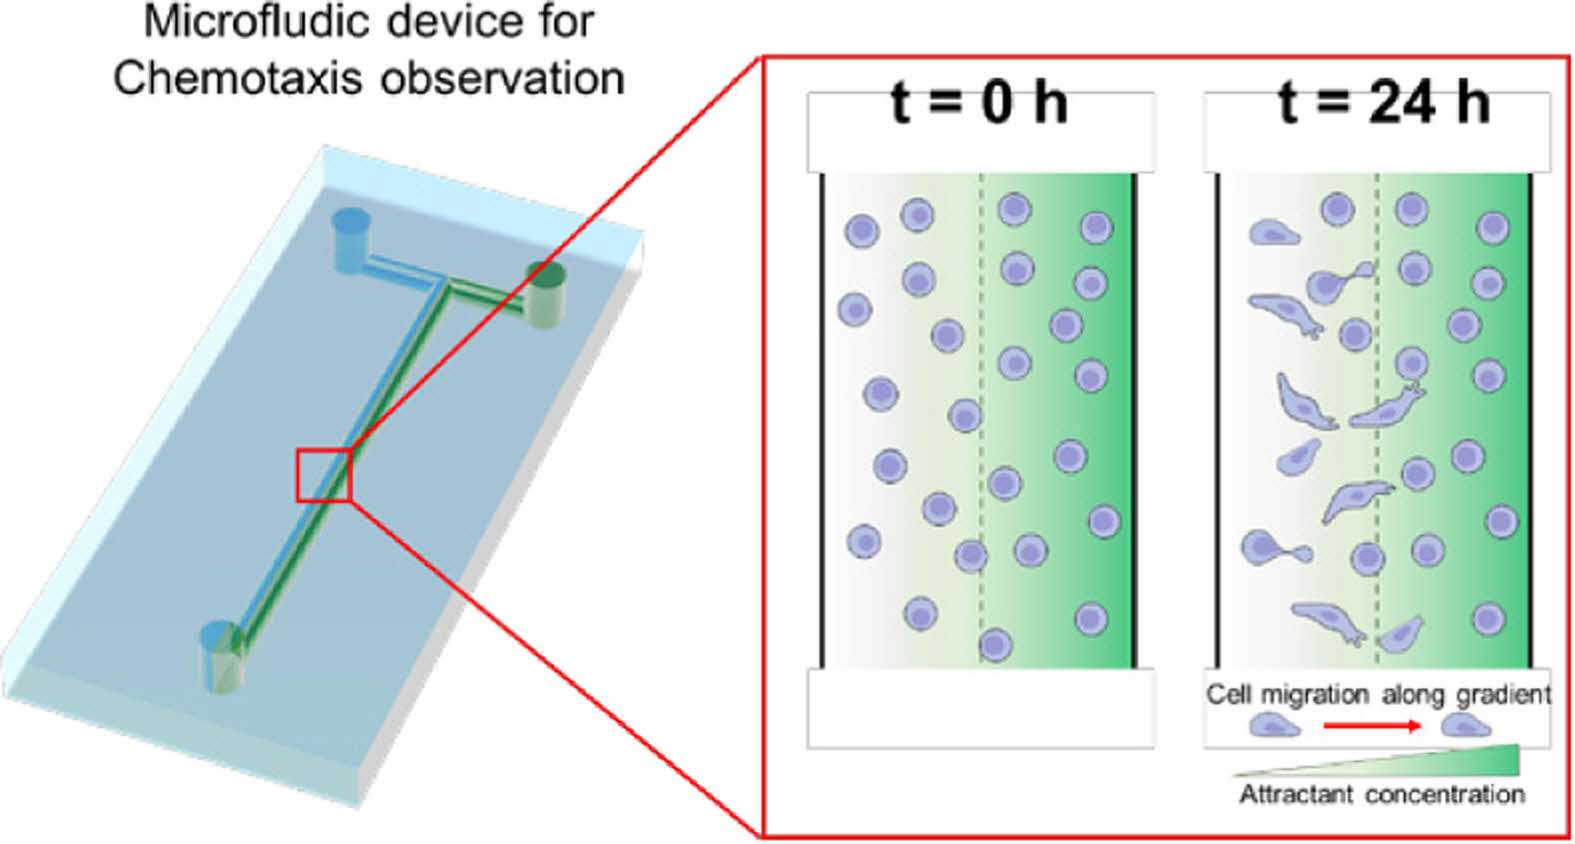
Scheme 1 shows the simple microfluidic device with two inlets and one outlet. The cell chamber was placed in the middle of the flow stream after the T-junction. The microfluidic device for chemotaxis analysis consisted of a PDMS layer and slide glass. After degassing and curing in an oven, the PDMS layer with a T-shape was obtained and then attached on the slide glass using plasma treatment. A culture media and its mixture with chemoattractant were individually introduced into the microfluidic device through left and right inlet holes, respectively. The gradient of the chemoattractant was established in the middle of the flow stream. Prior to fluid introduction, cell dispersion was introduced into the microfluidic device through the two inlets. The flow was then stopped for 2 h to allow cell adhesion on the slide glass. As schematically shown, cells in the chamber were exposed to different concentrations of the chemoattractant. Cells with the control media (left stream) moved toward the right stream with chemoattractant over time.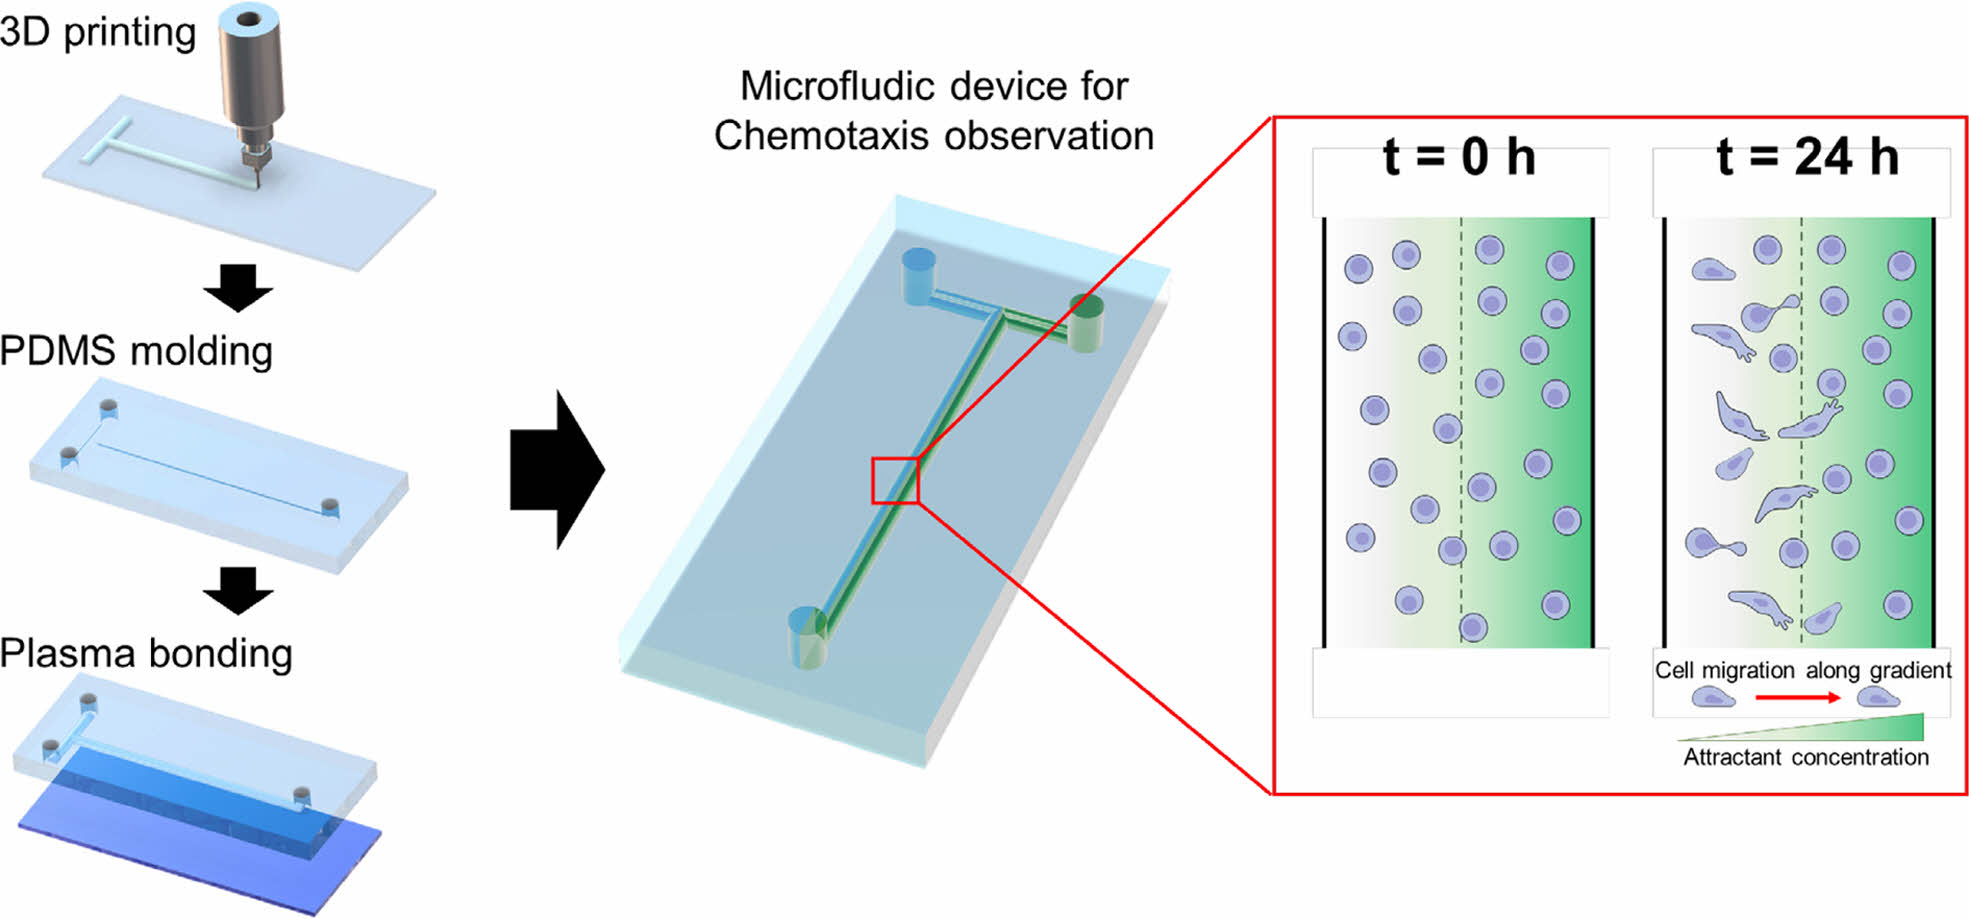
Scheme 1. Schematic diagram of the microfluidic device with a concentration gradient of a chemoattractant and cell migration at the cell
chamber.
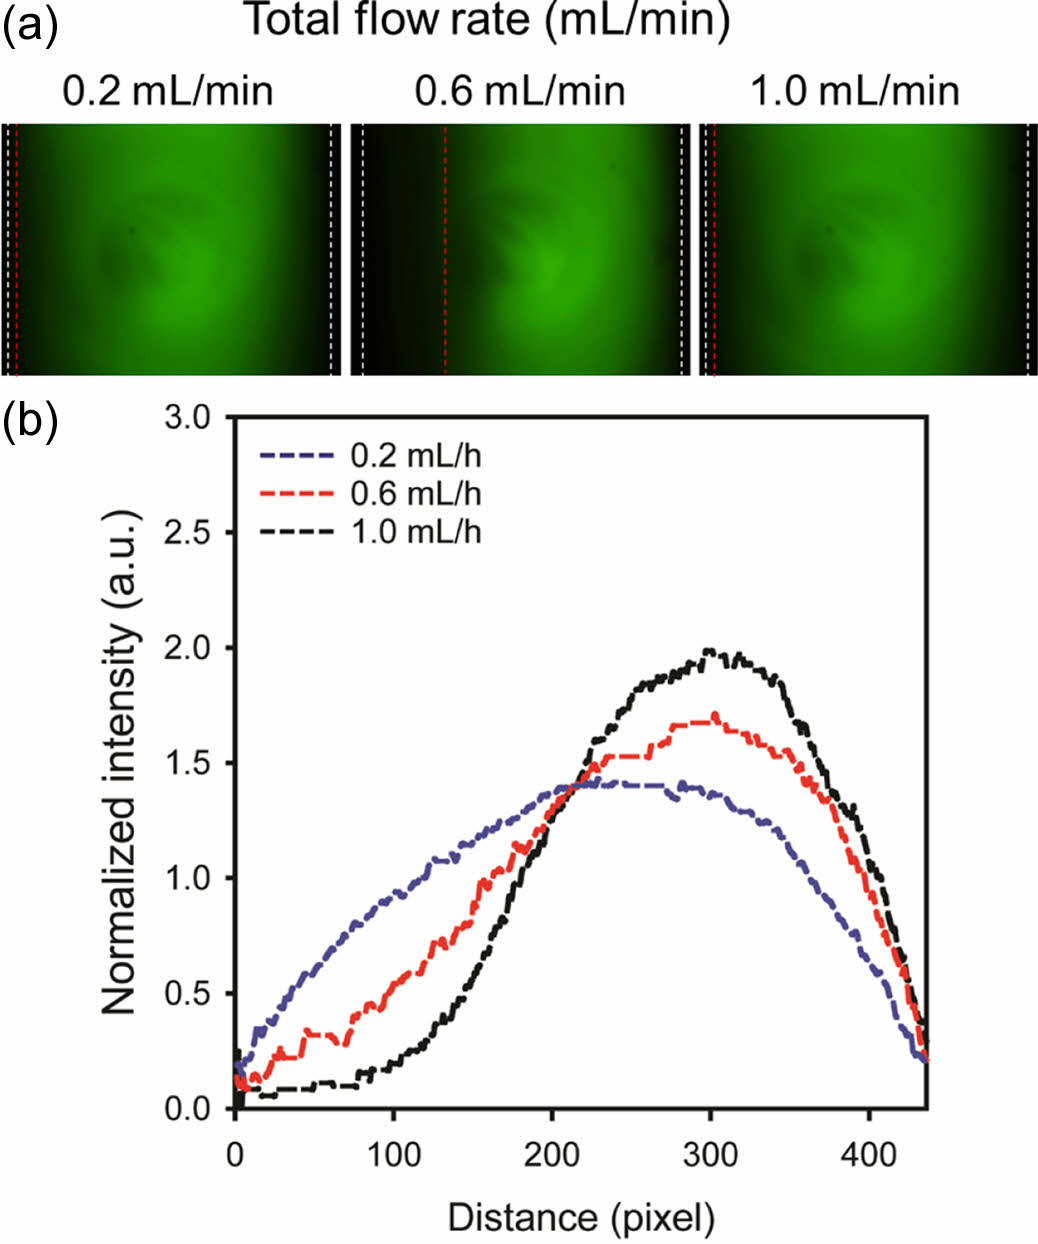
To evaluate the effect of flow rate on the concentration gradient, an aqueous phase and its mixture with a green fluorescent dye were introduced into left and right inlets of the microfluidic device, respectively. Figures 1(a) and 1(b) show fluorescent microscopy images of the chamber and the corresponding fluorescence profile across the gradient, respectively. Total flow rates were varied at 0.2, 0.6, and 1.0 mL/h. Flow rates of the two phases were the same. They were half of the total flow rate. At lower flow rates, the fluorescent profile expanded due to lateral diffusion of the dye. At a flow rate of 0.2 mL/h, the fluorescent profile took on a semicircular shape, which was not conducive to cell migration analysis. A well-established concentration gradient was observed at a flow rate of 1.0 mL/h. However, high shear stress caused some cells to detach from the slide glass. As a result, a flow rate of 0.6 mL/h was selected for the flow-based gradient due to its balance of gradient formation and cell adhesion.
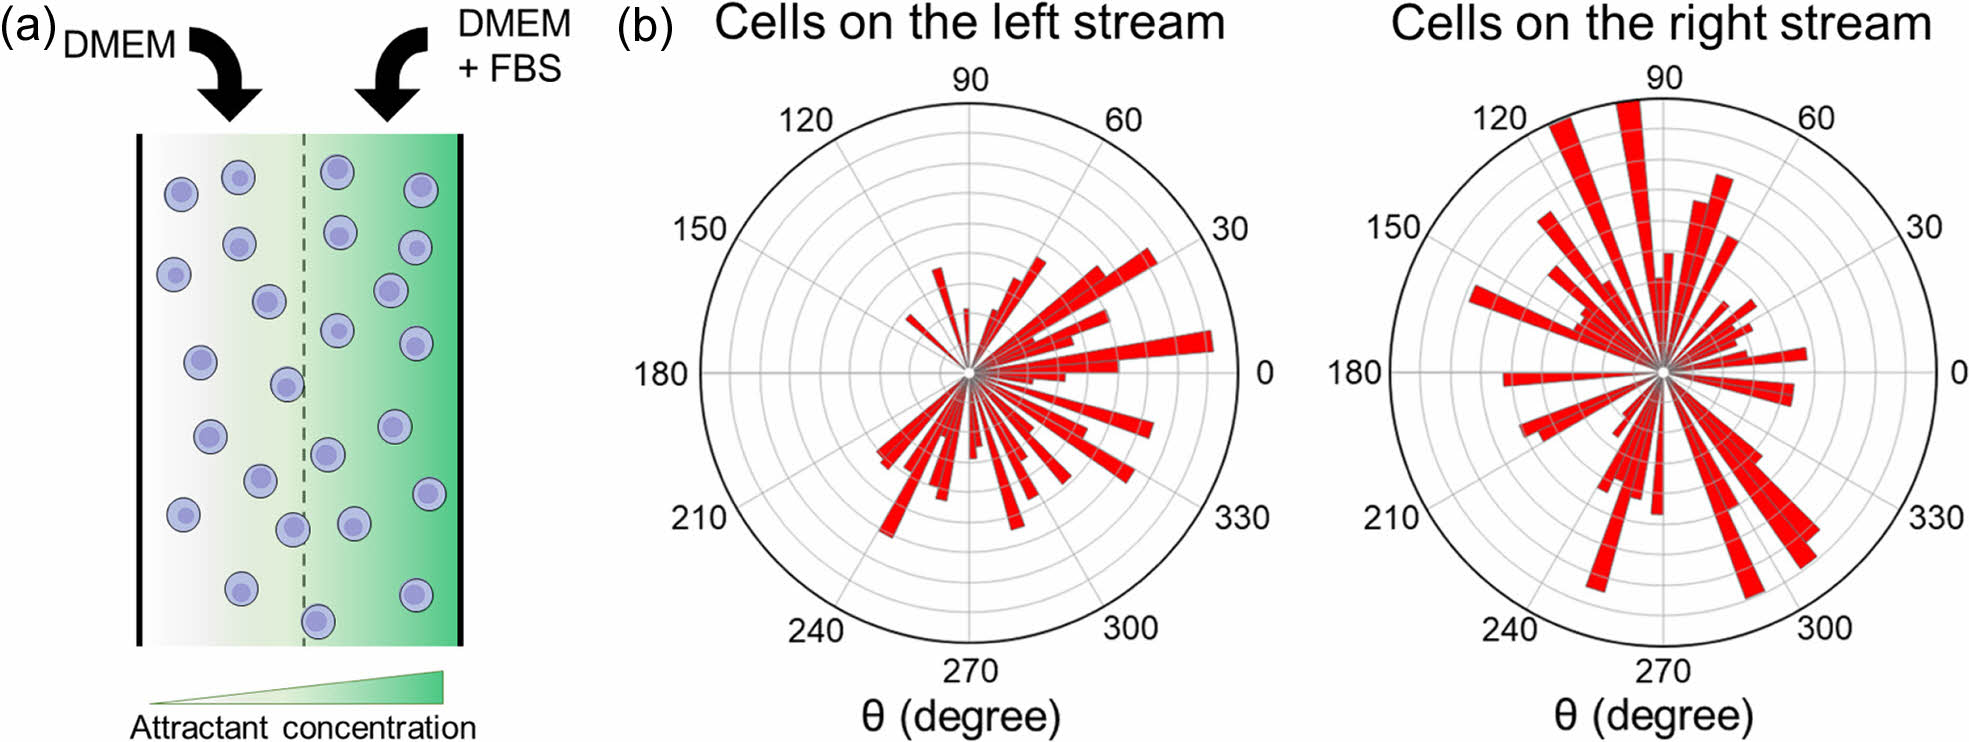
In this study, NIH/3T3 fibroblasts were utilized to test the feasibility of the simple microfluidic device for chemotaxis analysis. NIH/3T3 fibroblasts are commonly used in biomedical research due to their ease of growth in culture and their ability to create a preferable environment for growth.15 They are known for producing large amounts of extracellular matrix (ECM) proteins such as collagen, glycosaminoglycans, and proteoglycans.15 Therefore, they are an ideal model for studying cell migration and chemotaxis. Initially, a cell dispersion was introduced into the chamber as depicted in Figure 2(a). It was then washed with PBS. DMEM and a mixture of DMEM with FBS were introduced into the microfluidic device through separate inlet holes. As shown in Figure 2(b), a rose plot was used to illustrate the distance and angle of cell movement. Cells in the nutrient-deprived left stream (lacking FBS) exhibited a slow migration towards the DMEM stream enriched with FBS, indicating a response to the nutrient gradient. Conversely, cells in the right stream, where DMEM was mixed with FBS, demonstrated a random, non-directional movement pattern. This observation underscores the importance of a concentration gradient as a driving force for cell movement. In its absence, cell movement appears to be random and non-directional. This data reaffirms the critical role of nutrient gradients in guiding cell movement.16 Therefore, NIH/3T3 cells in the right stream showed a random movement. These results confirmed the feasibility of using such a simple microfluidic device for chemotaxis analysis.
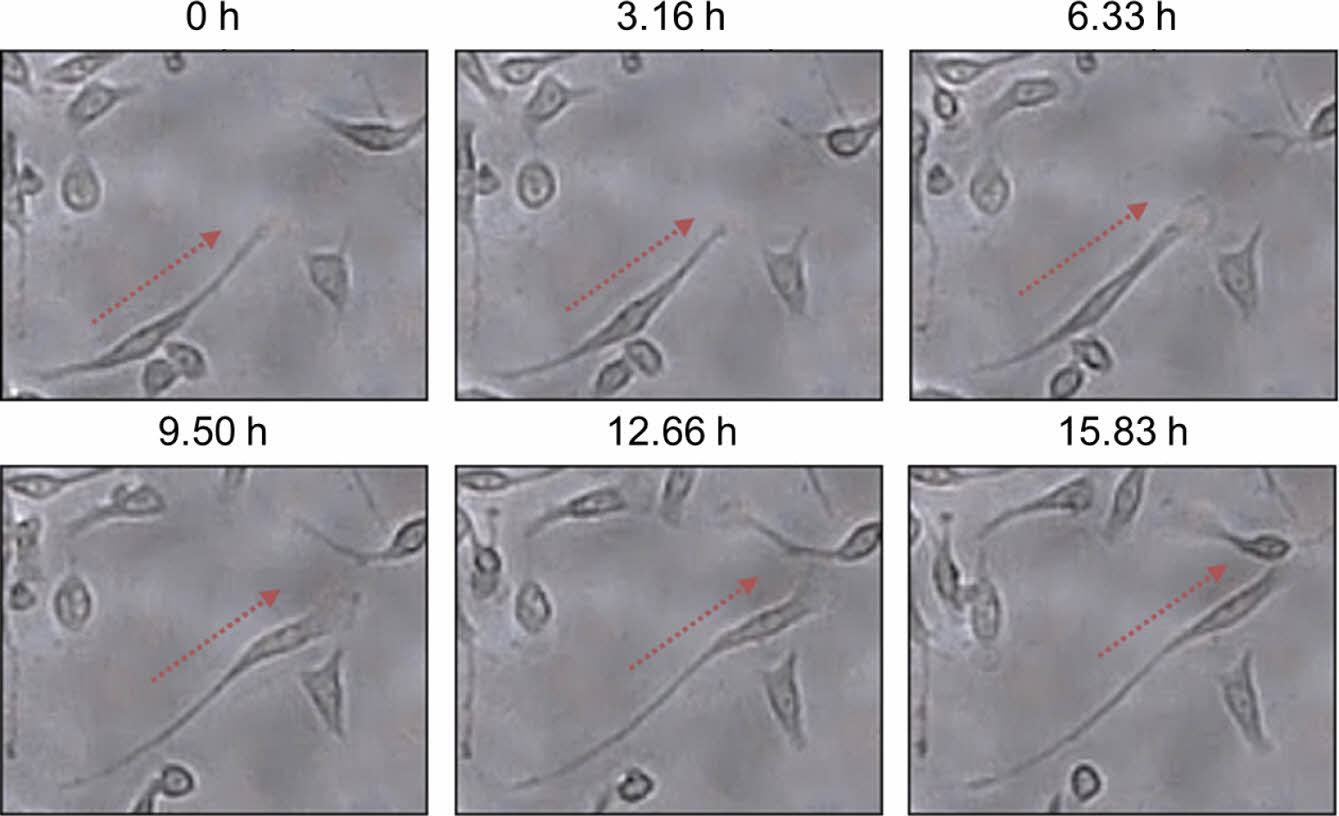
Figure 3 shows a series of time-lapse optical microscopy images capturing the migration of fibroblast cells located on the left side of the cell chamber. Most cells migrated toward the right side containing DMEM and FBS. These images provide strong visual evidence of a cell migration process in which the cytoplasm stretches first and then the cell body moves in the same direction.
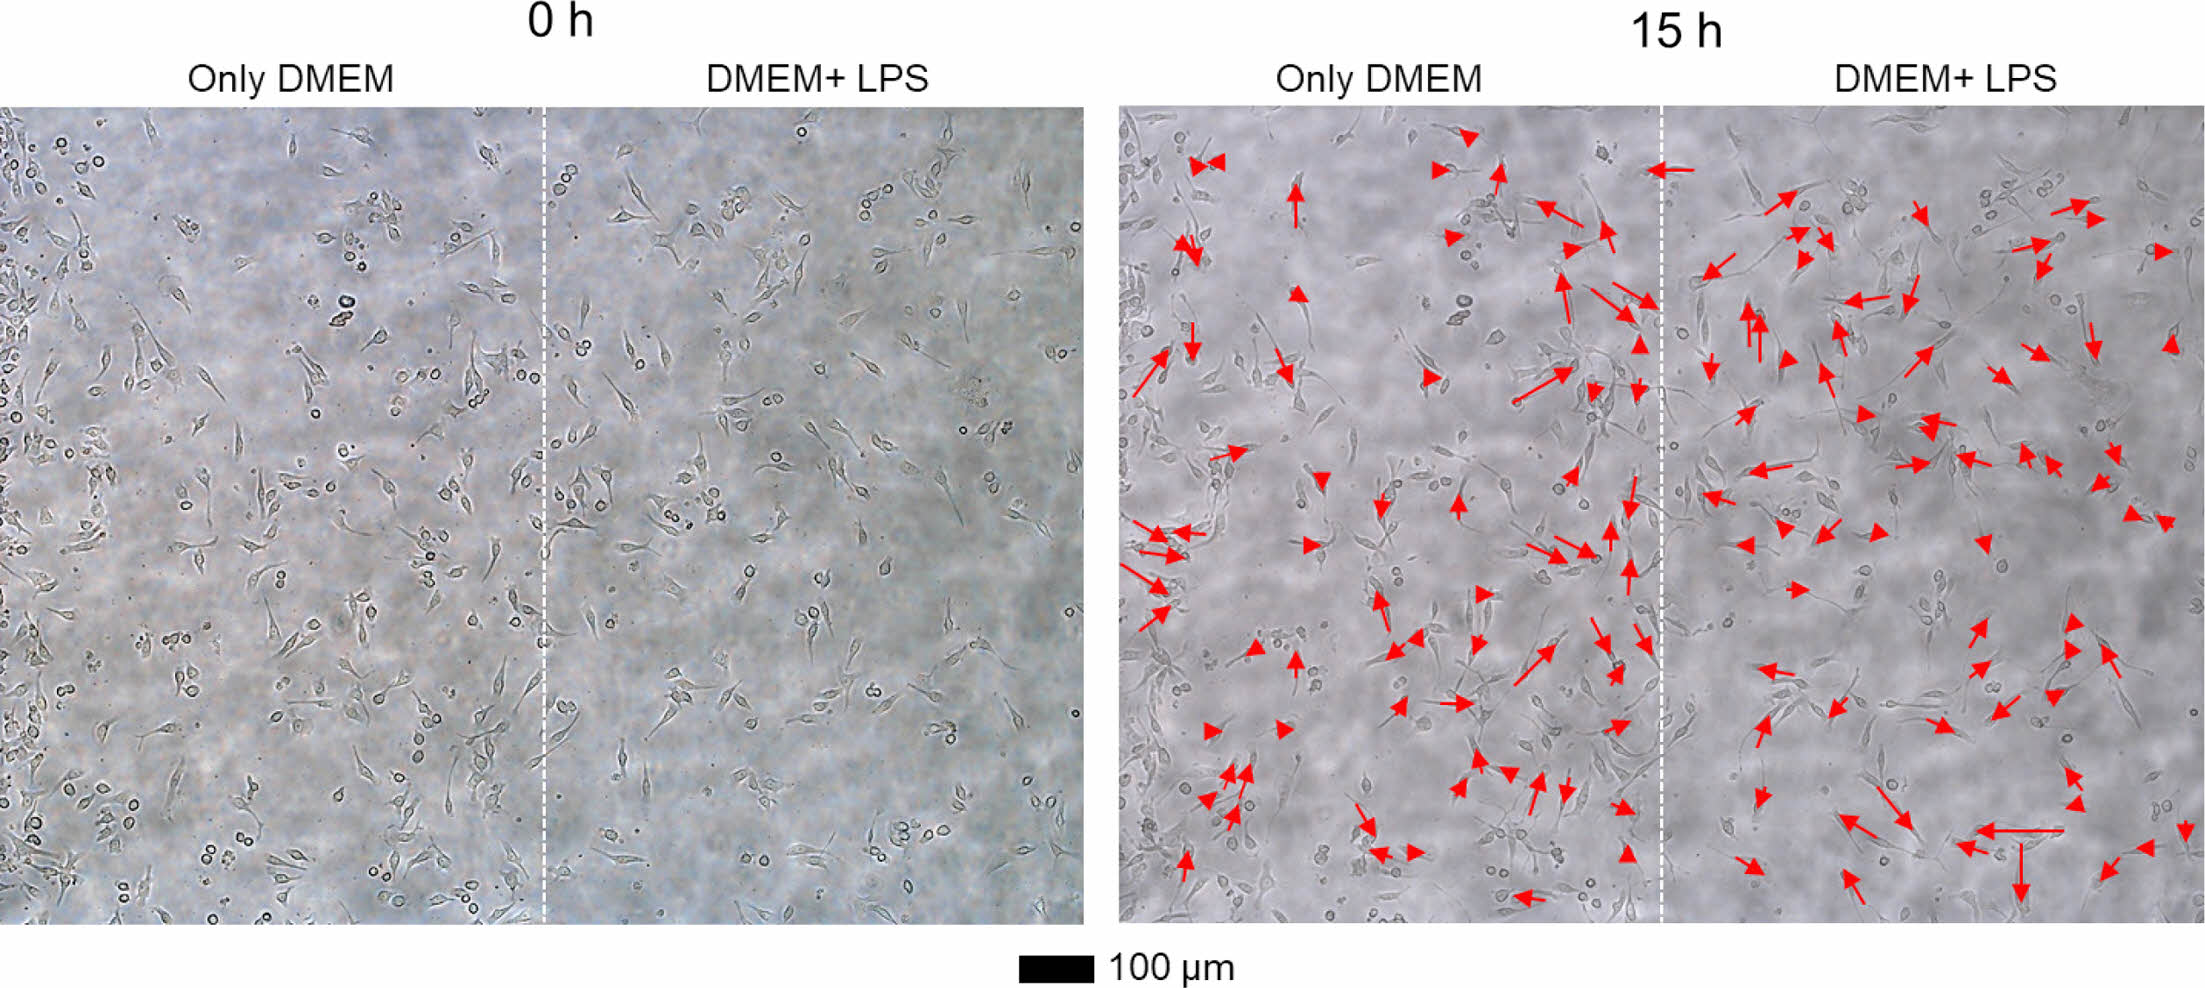
As a next step, we monitored the movement of RAW264.7 cells in the left DMEM and the right DMEM with LPS streams of the cell chamber. Figure 4 shows optical microscopy images of RAW264.7 cells at 0 and 15 h. The cells in the right stream (DMEM with LPS) randomly migrated at the low velocity. However, the cells in the left stream (only DMEM) tended to migrate toward the right direction.
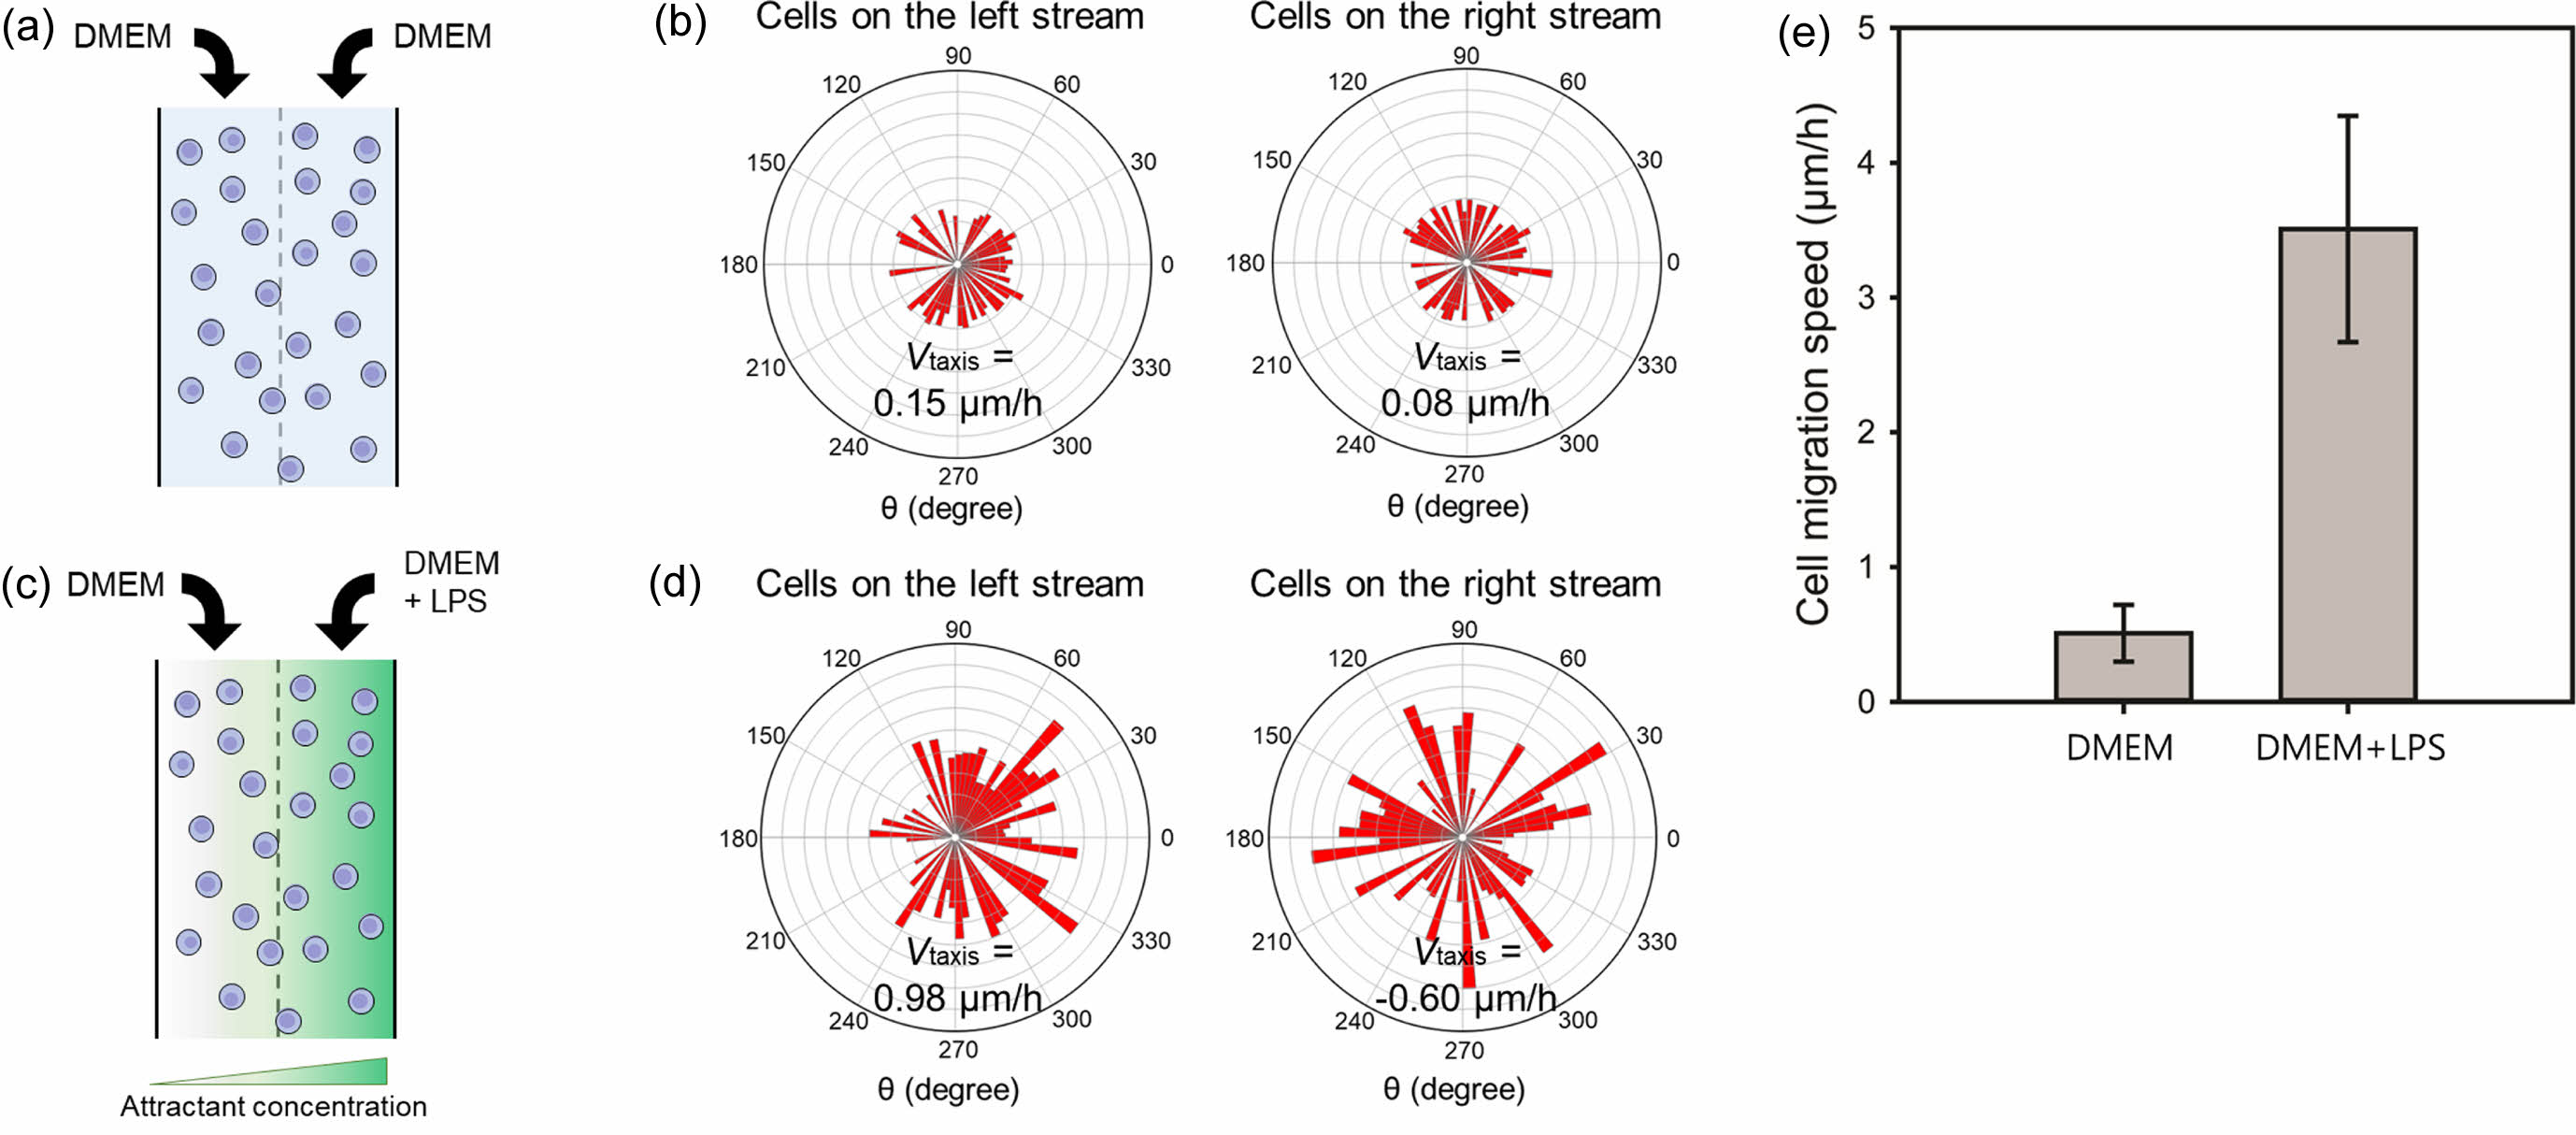
For a more quantitative analysis, lateral movement velocity denoted as Vtaxis was calculated. This was achieved by taking the average of x-velocities associated with each cell migration. Notably, positive velocities, which were directed towards the right stream, indicated movement towards higher nutrient concentrations, while negative velocities oriented towards the left stream indicated movement away from these concentrations. This method provided a robust measure of cell migration velocity, effectively accounting for the directionality of movement.17 The positive value of Vtaxis signifies a directional movement towards the attractant. Figures 5(a) and 5(b) illustrate the locomotion of RAW264.7 macrophage cells in response to a chemoattractant. As a control, DMEM was infused into the microfluidic device via both inlets. In the absence of a concentration gradient, cells exhibited a random motion in all directions at relatively low velocities of 0.15 and 0.08 μm/h for left and right streams, respectively. LPS was selected as a representative chemoattractant for RAW264.7 cells.18 A mixture of DMEM and LPS was introduced into the microfluidic device through the right inlet to assess macrophage migration (Figures 5(c) and 5(d)). In the left stream of the chamber, macrophages migrated towards the chemoattractant with a Vtaxis of 0.98 µm/h. Conversely, in the right stream, cells exhibited random migration in various directions with a Vtaxis of -0.60 µm/h, indicating a diminished migration compared to cells in the left stream.
Figure 5(e) showed the cell migration speed of the RAW264.7 cells located on the left side of the cell chamber in the absence (Figure 5(a)) or presence (Figure 5(c)) of LPS. The migration angle was not considered for the calculation of the cell migration speed to directly compare the moving distance over time. The cell migration speeds of the macrophages were
0.51 ± 0.21 and 3.51 ± 0.84 µm/h in the absence or presence of LPS, respectively. The result revealed that the RAW264.7 cells rapidly moved to the chemoattractant at a faster rate. These data strongly suggest that concentration gradients of chemoattractants within a simple microfluidic chip have the potential to be utilized in chemotaxis assays as they can effectively stimulate directional migration of cells toward specific molecular targets.
|
Figure 1 (a) Fluorescent microscopy images; (b) corresponding fluorescent profiles of the concentration gradient at different flow rates (0.2, 0.6, and 1.0 mL/h). |
|
Figure 2 (a) Schematic diagram of cells at the chamber; (b) movement of NIH/3T3 cells on left and right streams. The total number of cells was 50. |
|
Figure 3 Time-lapse optical microscopy images of fibroblast cells located on the left side of the cell chamber, showing that the cells moved toward the right direction over time. DMEM and DMEM with FBS were introduced into the cell chamber from the left and right sides, respectively (total flow rate of 0.3 mL/h). |
|
Figure 4 Representative optical microscopy images of RAW264.7 cells at 0 and 15 h. DMEM and DMEM with LPS were introduced into the cell chamber from the left and right sides, respectively. The movement of the cells was depicted using the red arrows. |
|
Figure 5 (a, c) A schematic diagram of cells at the chamber; (b, d) movement of RAW264.7 macrophage cells on left and right streams in the (a, b) absence or (c, d) presence of LPS. The total number of macrophage cells was 50 and 70 in the absence or presence of LPS, respectively; (e) Cell migration speed of the RAW264.7 cells located on the left stream of the cell chamber in the absence Figure 5(a) or presence Figure 5(c) of LPS. The migration angle was not considered for the calculation of the cell migration speed. |
We successfully designed a simple microfluidic chip capable of generating a concentration gradient of lipopolysaccharide within a cell chamber. Its gradient profiles could be easily manipulated based on the outcome by modulating the flow rate. This allowed us to visualize and quantitatively analyze cell migration behaviors within the cell chamber over time. We demonstrated the chemotaxis of fibroblasts and RAW264.7 using FBS and LPS as chemoattractants, respectively. This microfluidic-based chemotaxis analysis has potential to serve as a standard platform for evaluating cell chemotactic behaviors in response to specific biomolecules. This research deepens our understanding of cell chemotaxis, enabling more accurate predictions of cell behaviors and responses. It can be used to understand biological processes, identify causes of diseases, and develop new treatments.
- 1. Partida-Sanchez, S.; Desai, B. N.; Schwab, A.; Zierler, S. Editorial: TRP Channels in Inflammation and Immunity. Front. Immunol. 2021, 12, 684172.
-

- 2. Viola, A.; Munari, F.; Sánchez-Rodríguez, R. Scolaro, T.; Castegna, A.; The Metabolic Signature of Macrophage Responses. Front. Immunol. 2019, 10, 1462.
-
- 3. Gordon, S.; O. Martinez, F. Alternative Activation of Macrophages: Mechanism and Functions. Immunity 2010, 32, 593-604.
-
- 4. Pijuan, J.; Barceló, C.; Moreno, D. F.; Maiques, O.; Sisó, P.; Marti, R. M., Macià, A.; Panosa, A. In vitro Cell Migration, Invasion, and Adhesion Assays: From Cell Imaging to Data Analysis. Front. Cell Dev. Biol. 2019, 7, 107.
-
- 5. R. Justs, C.; Leffler, N.; Ruiz-Echevarria, M.; V. Yang, L. In vitro Cell Migration and Invasion Assays. J. Vis. Exp. 2014, 88, 51046.
-
- 6. Di Costanzo, E.; Ingangi, V.; Angelini, C.; Carfora, M. F.; Carriero, M. V.; Natalini, R. A Macroscopic Mathematical Model for Cell Migration Assays Using a Real-Time Cell Analysis. PLOS ONE 2016, 11, e0162553.
-
- 7. Boyden, S. The Chemotactic Effect of Mixtures of Antibody and Antigen on Polymorphonuclear Leucocytes. J. Exp. Med. 1962, 115, 453-466.
-
- 8. Zicha, D.; A. Dunn, G.; F. Brown A. A New Direct-viewing Chemotaxis Chamber. J. Cell Sci. 1991, 99, 769-775.
-
- 9. Su, R.; Wang, F.; C. McAlpine, M. 3D Printed Microfluidics: Advances in Strategies, Integration, and Applications, Lab. Chip.2023, 23, 1279-1299.
-
- 10. Lv, M.; He, X.; Zhou, K.; Niu, B.; Wei, W.; Li, H.; Liu, S.; Su, H.; Wang, W. Fabrication of Microfluidic Chips Using Laser Click Deposition, Sens. Diagn. 2022, 1, 803-809.
-
- 11. Paul Urbanski, J.; Thies, W.; Rhodes, C.; Amarasinghe, S.; Thorsen, T. Digital Microfluidics Using Soft Lithography, Lab. Chip.2006, 6, 96-104.
-
- 12. Ortseifen, V.; Viefhues, M.; Wobbe, L.; Grünberger, A. Microfluidics for Biotechnology: Bridging Gaps to Foster Microfluidic Applications. Front. Bioeng. Biotechnol. 2020, 8, 589074.
-
- 13. Mathew, D. G.; Beekman, P.; Lemay, S. G.; Zuilhof, H.; Le Gac, S.; Van der Wiel, W. G.; Electrochemical Detection of Tumor-Derived Extracellular Vesicles on Nanointerdigitated Electrodes, Nano Lett. 2020, 20, 820-828.
-
- 14. Laura Coluccio, M.; Antonia D’Attimo, M.; Marica Cristiani, C.; Candeloro, P.; Parrotta, E.; Dattola, E.; Guzzi, F.; Cuda, G.; Lamanna, E.; Carbone, E.; Krühne, U. Passive Microfluidic Device for Chemotaxis Studies. Mircromachines 2019, 10, 551.
-
- 15. Caneparo, C.; Baratange, C.; Chabaud, S.; Bolduc, S. Conditioned Medium Produced by Fibroblasts Cultured in Low Oxygen Pressure Allows the Formation of Highly Structured Capillary-like Networks in Fibrin Gels. Sci. Rep. 2020, 10, 9291.
-
- 16. Ren, J.; Wang, N.; Guo, P.; Fan, Y.; Lin, F.; Wu, J. Recent Advances in Microfluidics-based Cell Migration Research. Lab. Chip. 2022, 22, 3361-3376.
-
- 17. Deroy, C.; N. Rumianek, A.; H. R. Wheeler, J.; Nebuloni, F.; R. Cook, P.; R. Greaves, D.; J. Walsh, E. Assaying Macrophage Chemotaxis Using Fluid-Walled Microfluidics, Adv. Mater. Technol. 2022, 7, 2200279.
-
- 18. Matheus Facchin, B.; Oliveira Dos Reis, G.; Nicacio Vieira, G.; Talita Bramorski Mohr, E.; Salvan da Rosa, J.; Fabricia Kretzer, I.; Galhardo Demarchi, I.; Monguilhott Dalmarco, E. Inflammatory Biomarkers on an LPS-induced RAW 264.7 Cell Model: a Systematic Review and Meta-analysis. Inflamm. Res. 2022, 71, 741-758.
-

- Polymer(Korea) 폴리머
- Frequency : Bimonthly(odd)
ISSN 0379-153X(Print)
ISSN 2234-8077(Online)
Abbr. Polym. Korea - 2023 Impact Factor : 0.4
- Indexed in SCIE
 This Article
-
2024; 48(2): 217-222
Published online Mar 25, 2024
- 10.7317/pk.2024.48.2.217
- Received on Nov 27, 2023
- Revised on Jan 9, 2024
- Accepted on Jan 9, 2024
Services
- Full Text PDF
- Abstract
- ToC
- Acknowledgements
- Conflict of Interest
Introduction
Experimental
Results and Discussion
Conclusions
- References
Shared
Correspondence to
- Sung-Wook Choi
-
*Biomedical and Chemical Engineering, Department of Biotechnology, The Catholic University of Korea, 43 Jibong-ro, Wonmi-gu, Bucheon-si, Gyeonggi-do, 14662, Korea
**Department of Biotechnology, The Catholic University of Korea, 43 Jibong-ro,
Wonmi-gu, Bucheon-si, Gyeonggi-do, 14662, Korea - E-mail: choisw@catholic.ac.kr
- ORCID:
0000-0002-5075-8798
Hyecheon Building(Room 601), #354, Gangnam-Daero, Gangnam-Gu, Seoul 06242, Korea
TEL : 82-2-568-3860, 561-5203, 569-3860 FAX : 82-2553-6938 E-mail: polymer@polymer.or.kr