- Synthesis of Cationic Polymer Dots for Perrhenate Anion Detection in Aqueous Solutions
Department of Chemical Engineering, Keimyung University, 1095 Dalgubeoldaero, Dalseo-gu, Daegu 42601, Korea
- 수용액에서 퍼리네이트 음이온 검출을 위한 양이온성 고분자 점 제조
계명대학교 공과대학 화학공학과
Reproduction, stored in a retrieval system, or transmitted in any form of any part of this publication is permitted only by written permission from the Polymer Society of Korea.
In this study, cationic polymer dots (CPDs) were fabricated for the efficient detection of perrhenate anions, which is a radioactive pertechnetate surrogate, in aqueous solutions. The CPD fluorescence intensity decreased significantly with increasing perrhenate concentration following the Langmuir isotherm model. The detection limit was 0.0102 μM, which is extremely low compared to that in previous reports. According to the hard-soft acid-base theory, CPDs showed negligible fluorescence changes for hard base anions, such as chloride, nitrate, and sulfate. However, for soft base anions, such as perrhenate and iodide, the fluorescence intensity considerably decreased. For iodide, the decrease was uniform over the entire emission range, resulting in simple quenching. For perrhenate, the decrease was smaller at 470 nm than that at 410 nm, resulting in a fluorescence color shift from blue to cyan. Thus, CPDs can selectively detect perrhenate in aqueous solutions by monitoring the fluorescence color and intensity changes.
본 연구에서는 방사성 물질인 퍼테크네테이트(TcO4-)의 대용물질인 퍼리네이트(ReO4-) 음이온을 수용액에서 효율적으로 검출하기 위하여 양이온성 고분자 점(CPD)을 제조하였다. 수용액에서 퍼리네이트 음이온의 농도가 증가함에 따라 CPD의 형광 강도는 랑뮤어 흡착 등온 모델을 따르면서 크게 감소하였다. 검출 한계는 0.0102 μM로 기존 문헌에 보고된 값들에 비하여 매우 낮았다. 굳은-무른 산-염기 이론을 따라서, CPD는 염소 음이온, 질산 음이온, 황산 음이온과 같은 굳은 염기성 음이온들에 대해서는 형광 변화가 미미한 것으로 나타났다. 그러나, 퍼리네이트와 요오드 음이온과 같은 무른 염기성 음이온들에 대해서는 형광 강도가 크게 감소하였다. 요오드 음이온에서는 전체 형광 방출 범위에서 형광 감소가 균일하게 일어났으나, 퍼리네이트 음이온에서는 410 nm에서보다 470 nm에서 감소폭이 더 작아 형광의 색깔이 파란색에서 청록색으로 바뀌었다. 제조된 CPD를 사용하여 형광 색상과 강도 변화를 모니터링하여 수용액에서 퍼리네이트를 선택적으로 검출할 수 있었다.
Cationic polymer dots (CPDs) were fabricated for the efficient detection of perrhenate anions, which is a radioactive pertechnetate surrogate, in aqueous solutions. CPDs can selectively detect perrhenate in aqueous solutions by monitoring the fluorescence color and intensity changes.
Keywords: cationic polymer dot, perrhenate anion, fluorescence sensor, hard-soft acid base theory, static quenching.
This study was supported by the National Research Foundation of Korea (NRF) and grant-funded by the Korean government (MSIT) (grant number 2020R1F1A1048770).
The authors declare that there is no conflict of interest.
Information is available regarding the synthetic procedure, thermogravimetric analysis curves, XPS survey spectrum, fluorescence emission wavelength changes of the CPDs according to the excitation wavelength change, and the comparison of the performance of CPD with that of other sensors for detecting perrhenate anion. The materials are available via the Internet at https://journal.polymer-korea.or.kr.
PK_2025_049_02_170_Supporting_Information.pdf (480 kb)
Supplementary Information
One possible source of radioactive waste is technetium, which is produced during the generation of nuclear power. Technetium can harm human health by accumulating in the thyroid gland and intestines if leaked into the environment and ingested.1,2 Technetium has a long half-life of 2.13×10⁵ years and typically exists in its most stable oxidation state as pertechnetate (TcO4-).3–5 Pertechnetate is physiologically toxic, highly soluble, and easily mobile in the environment, contaminating groundwater and entering the human body via aquatic organisms.3 Because pertechnetate is radioactive, it cannot be used directly in laboratories. Therefore, perrhenate (ReO4-), a non-radioactive material with a similar size, geometry, and hydration energy, can be used as an experimental surrogate.3,6
Various methods exist for the analysis of anions in aqueous solutions, such as ion chromatography (IC), mass spectrometry (MS), inductively coupled plasma atomic emission spectroscopy (ICP-AES), and fluorescence sensors.7-10 IC, MS, and ICP-AES can provide quantitative analysis and high sensitivity; however, they have drawbacks, such as requiring large and costly equipment, high initial and maintenance expenses, skilled personnel requirements, complicated pretreatment procedures, and operator-dependent results.5,11 In contrast, fluorescent sensors made from nanoparticles are simple and advantageous in terms of visual detection, high sensitivity, and low background interference.12 Therefore, fluorescent sensors are attracting increasing research interest.
Nanoparticles used in fluorescent sensors include gold,13 semiconductor quantum dots,14 and carbon quantum dots (CQDs). Gold nanoparticles are easy to synthesize and bind to reactive ligands, such as phosphines, amines, and thiolates. Moreover, their sizes and shapes can be varied by modifying their synthesis methodology. However, they tend to easily aggregate and are expensive.13 Semiconductor quantum dots have outstanding optical properties and exhibit high quantum yields, but they have disadvantages, such as low dispersibility and high toxicity.14
This study used CQDs as a fluorescence sensor to overcome the drawbacks of using gold nanoparticles and semiconductor quantum dots. CQDs are zero-dimensional materials with sizes ˂ 10 nm that were discovered in 2004 during the purification of carbon nanotubes.15-18 They have a central core of sp2 and sp3 hybridized carbon atoms and a surface containing various functional groups. The optical properties and colors of CQDs can be adjusted by controlling the surface functional groups, in addition to the quantum confinement effect.15-17 Moreover, CQDs have advantages, such as high photostability, high photoluminescence, photobleaching resistance, low toxicity, high biocompatibility, simple synthesis, excellent solubility, and cost-effectiveness. These advantages render them suitable for applications in bioimaging, photocatalysis, drug delivery, LEDs, solar cells, and fluorescence sensors.15-18
Based on their structure and properties, CQDs are classified as graphene quantum dots (GQDs), carbon nanodots (CNDs), and polymer dots (PDs).19,20 GQDs are carbonized from one or more layers of two-dimensional graphene. They are anisotropic with an average size of ˂ 100 nm and a width larger than the height of the graphene layers.15,19,21,22 CNDs can be divided into two types: those with and those without crystal lattices. The CNDs without a crystal lattice have a glassy carbon composition and an amorphous quasi-spherical shape. CNDs with a crystal lattice have an average interlayer distance of 0.34 nm.19,21 PDs are synthesized from precursors such as linear polymers, monomer aggregates, and cross-linked polymers. These precursors have polymerizable groups such as hydroxyl (–OH), carboxyl (–COOH), amine (–NH2), and double bonds (–C=C). Therefore, PDs have a polymer/carbon hybrid structure characterized by both CQDs and polymers. CNDs have a boundary between the CQD core and functional groups, whereas PDs do not.19,23
CQDs can be prepared using top-down or bottom-up methods. The top-down method decomposes large carbon-based precursors, such as activated carbon, carbon nanotubes, graphite, and graphene, using strong physical energy. Examples of the top-down methods include electrochemical oxidation,24 laser ablation,25 and arc discharge.26 The top-down method has drawbacks, such as complicated conditions, large equipment requirements, high initial cost, and long synthesis time. The bottom-up method uses molecular organic materials and polymers as precursors. Examples of the bottom-up methods include microwave,27 ultrasonic,28 and hydrothermal syntheses.29 The bottom-up method has the advantage of using inexpensive materials to easily fabricate CQDs; therefore, it is widely used. Hydrothermal synthesis is a bottom-up method involving the preparation of CQDs by heating a precursor at high temperatures. The size and shape of the CQDs are adjusted by controlling the temperature, time, and pressure. In this study, a relatively simple hydrothermal synthesis method was used to prepare CQDs.
As an oxoanion in aqueous media, the perrhenate anion is challenging to detect using fluorescence sensors because of its low charge density and large size.30,31 Previous studies have used fluorescent sensors, such as 1-pyrenemethylamine,6 auramine O,30 and thioflavin-T,31 to detect perrhenate anions. These sensors are rapid and simple but costly and have high detection limits of 14, 270, and 260 μM. Recently, we developed CQDs as a fluorescent sensor for detecting perrhenate anions.32 This sensor had a lower detection limit and cost than that for previous sensors. However, the fabricated CQD sensor had a low zeta potential despite its cationic surface charge. To improve the interaction between CQDs and perrhenate anions, and thus enhance anion detection, the surface charge should be increased.
PDs are synthesized from precursors containing functional groups, such as amine or hydroxyl groups. A previous study reported the synthesis of cationic PDs via a hydrothermal method using the amine-containing polyethyleneimine as a precursor.33,34 In this study, PDs with high positive surface charges were synthesized using polydiallyl dimethyl ammonium chloride (polyDDA) as the precursor. PolyDDA has cationic properties, a high carbon content, amine functional groups, and spontaneous spherical micelle structures.35 The synthesized PDs were then used to detect perrhenate anions in aqueous solutions.
Reagents. PDs were synthesized from a polyDDA solution ((C8H16NCl)n, average Mw < 100000, Sigma-Aldrich, 35 wt%, USA) and deionized water. A dialysis bag (Spectra/Por Dialysis Membrane, prewetted RC Tubbing, MWCO 14000 Da) was used to purify the PDs. For the fluorescence and selective detection experiments, sodium perrhenate (NaReO4, Sigma-Aldrich, 99.99%, USA), sodium iodide (NaI, Sigma-Aldrich, > 99.0%, USA), sodium chloride (NaCl, Sigma-Aldrich, > 99.0%, USA), sodium nitrate (NaNO3, Sigma-Aldrich, > 99.0%, USA), and sodium sulfate (Na2SO4, Sigma-Aldrich, > 99.0%, USA) were used.
Syntheses. Using a hydrothermal method, PD was synthesized by filling an autoclave with polyDDA (10 mL) and heating the material at 200 ℃ for 10 h before cooling it to 20 ℃. The resulting solution was diluted using distilled water (20 mL) and sonicated for 20 min (U1tech, JAC-5020, Korea). The solution was then centrifuged at 3500 rpm for 30 min (Daihan Scientific, Cef-D50.6, Korea) to remove any carbon lumps and obtain a dark brown supernatant. The supernatant was dialyzed for 1 d to eliminate unreacted substances and then evaporated using a rotary evaporator (Buchi, R-200A, Korea) to yield a sticky material. The material was finally vacuum-dried at 60 ℃ for 1 d to produce dark brown cationic polymer dots (CPDs). The synthetic procedure of the CPDs is shown in the Supporting Information (Figure S1).
Characterization. Field emission transmission electron microscopy (FE-TEM, FEI Company, Titan G2 ChemiSTEM Cs Probe, USA) was used to examine the morphology and size of the CPDs. X-ray diffraction (XRD, Malvern Panalytical, Empyrean, UK) was employed to determine the crystallinity and interlayer spacing of the CPDs. A zeta potential analyzer (Malvern Panalytical, Zetasizer Nano ZS, UK) was used to measure the CPD zeta potential. Thermogravimetric analysis (TGA, TA Instruments, TGA 55 System, USA) was performed to evaluate the thermal stability of the CPDs. Fourier-transform infrared spectroscopy (FTIR, Thermo Scientific, Nicolet Summit, USA) and X-ray photoelectron spectroscopy (XPS, Thermo Fisher, Nexsa, USA) were used to identify the chemical bonding states and surface functional groups of the CPDs. The fluorescence properties of the CPD sensor and its response to perrhenate and other anions were investigated using a fluorospectrophotometer (Agilent Technologies, Cary Eclipse, USA). An ultraviolet-visible (UV-Vis) spectrophotometer (Thermo Scientific, Thermo Evolution One, USA) was employed to record the absorbance spectra of CPDs and the anions.
Fluorescence Experiments. A fluorospectrophotometer was used to record the CPD emission spectra at different excitation wavelengths. The concentration of the CPD aqueous solution was 250 ppm, and the excitation wavelength ranged from 310 to 490 nm in 20 nm increments.
In addition, the fluorospectrophotometer was employed to investigate the fluorescence response of the CPDs to different anions, such as perrhenate (ReO4−), iodide (I−), chloride (Cl−), nitrate (NO3−), and sulfate (SO42−). The fluorescence spectra of the aqueous CPD solutions were obtained immediately after adding the anions. The concentration of the CPDs remained at 250 ppm, and the anion concentrations varied from 0 to 2500 μM with 10 different values (0, 0.5, 5, 50, 100, 200, 300, 400, 500, 1250, and 2500 μM).
Characterization. Using a polymer with an amine group as the precursor for the hydrothermal synthesis of PDs results in crosslinking and entanglement with increasing temperature. This forms long chains and coils that become dense and stable as crosslinking advances inside the coils. As carbonization progresses, the polymer structure diminishes, and fine crystalline regions and lattice-like internal structures emerge. The degree of carbonization influences the fluorescence of the PDs. Incomplete carbonization enables polymer chains to act as functional groups and display high reactivity and fluorescence. However, complete carbonization eliminates the functional groups and reduces the fluorescence.23 The following characterizations were performed to investigate the successful synthesis of the CPDs, which contain amine functional groups and exhibit fluorescence, from the polyDDA precursor.
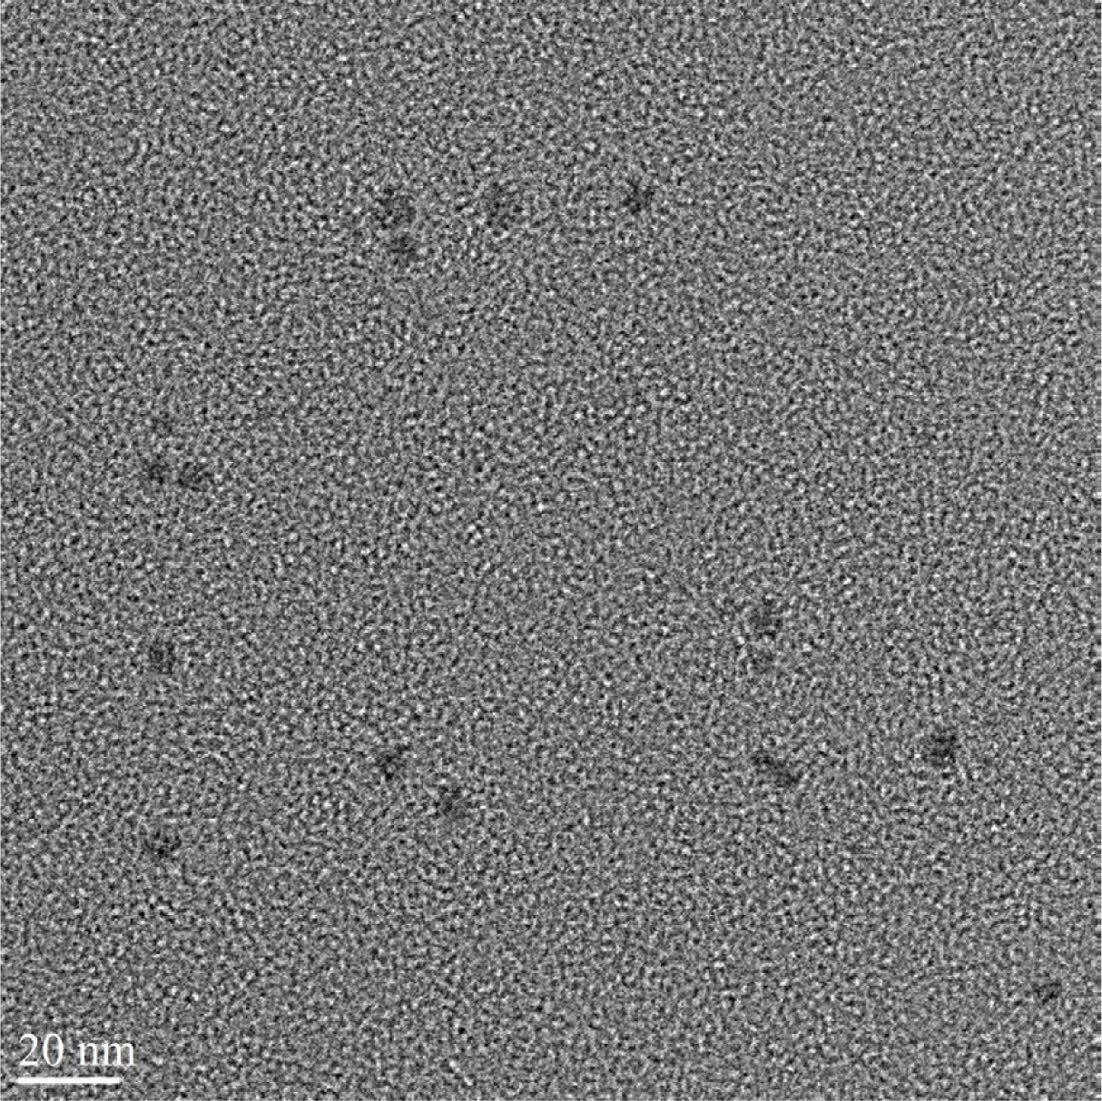
The shape and particle size of the CPDs were characterized using FE-TEM analysis after ultrasonic dispersion in ethanol. The acceleration voltage used for the measurements was 200 kV, and the result is shown in Figure 1. The CPDs presented as quasi-spherical particles with sizes ranging from 5 to 8 nm, without clear boundaries between the functional groups and cores. These features are consistent with the typical properties of PDs.
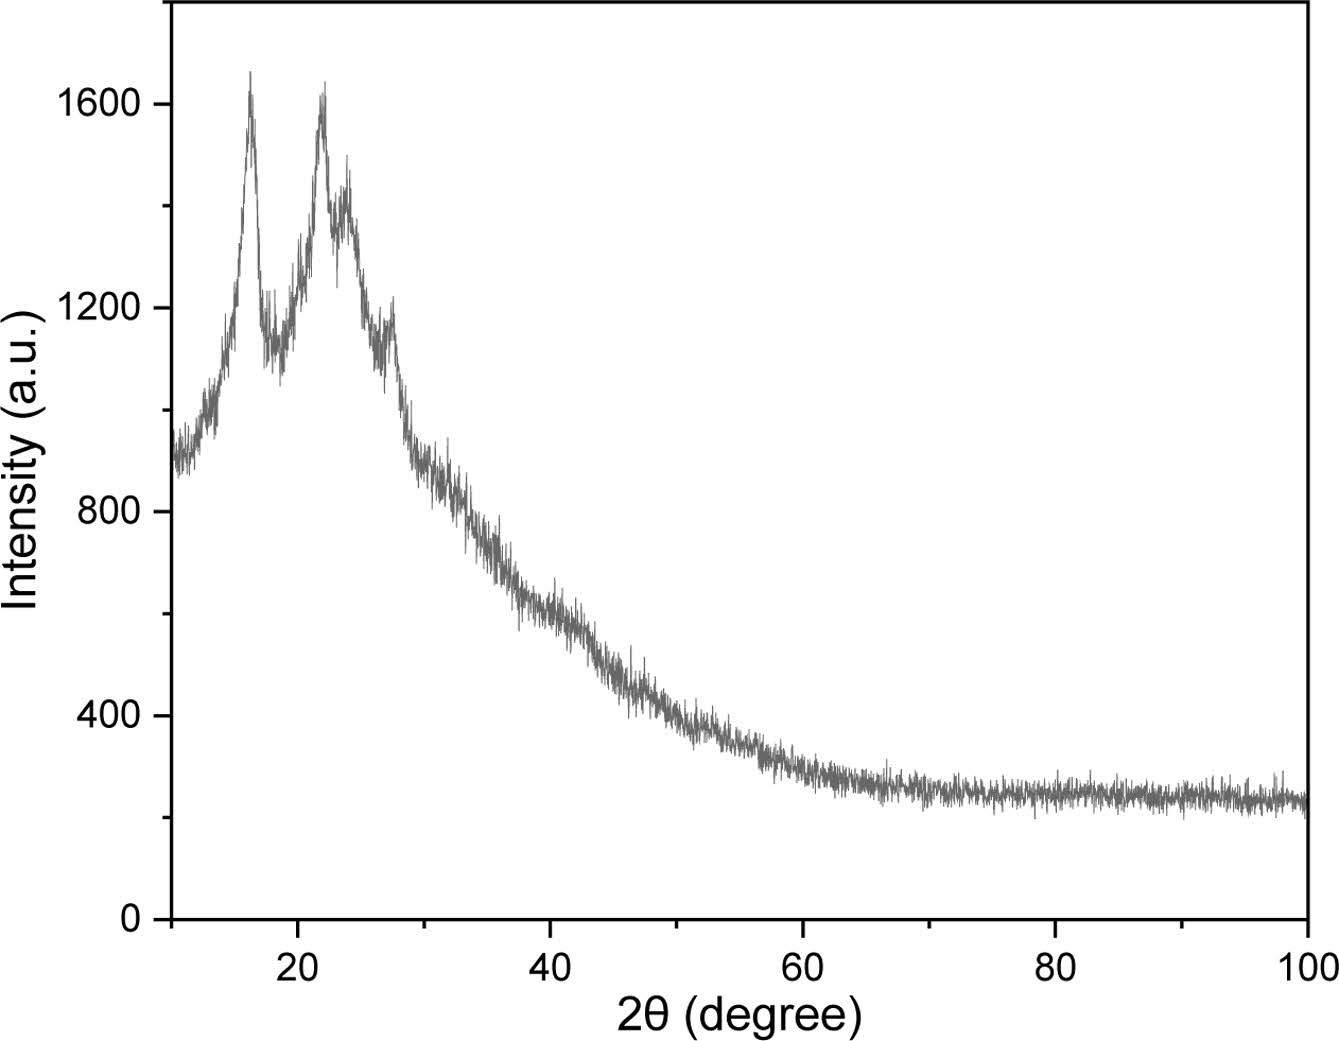
The crystallinities and interlayer spacings of the prepared CPDs were measured using XRD. Cu Kα rays (λ = 1.54 nm) were used for the measurement, and the generator voltage and tube current were 40 kV and 30 mA, respectively. XRD diffraction peaks appear at the 2θ values of 16.295°, 21.888°, 23.884°, and 27.534°, and the result is shown in Figure 2. Using the Bragg equation, interlayer spacing values of 0.54, 0.41, 0.37, and 0.32 nm corresponded to each 2θ value. These results suggest that the internal structure of PDs is relatively disordered, despite the formation of a central core during the carbonization process of polyDDA and the emergence of microcrystalline regions and lattices.
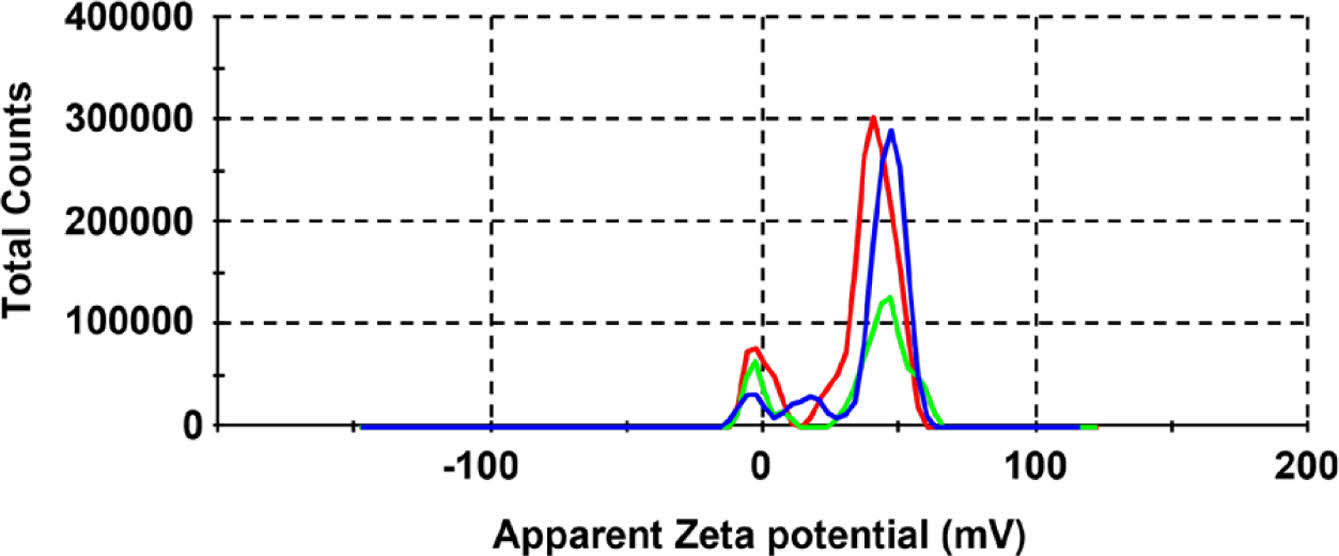
The CPD surface prepared using the cationic polymer polyDDA was expected to be positively charged. The zeta potential of the CPDs dispersed in water was measured (Figure 3). The zeta potential distribution of CPD was not symmetric; however, the zeta potential was +33.9 mV. Aggregation is likely to occur when the absolute value of the zeta potential is close to zero but does not occur when the absolute value is ³ 30 mV; instead, a stable colloid is formed.36 Therefore, the prepared CPDs formed a stable colloid and electrostatically interacted with the perrhenate anion owing to its positively charged surface.
Thermogravimetric analyses of the CPDs and polyDDA were performed, and the results are shown in the Supporting Information (Figure S2). The weight change was measured while heating up to 800 ℃ at a heating rate of 20 ℃/min under a nitrogen atmosphere. Moisture in the CPDs and polyDDA was removed at approximately 100 ℃, thereby decreasing the weight of the samples. PolyDDA lost 15.1% weight during the first thermal decomposition from 274.8 to 420.8 ℃. The second thermal decomposition from 420.8 to 800 ℃ resulted in an additional 16.0% weight loss, leaving a residual amount of 4.5%. The CPDs lost 26.1% weight during the first thermal decomposition from 300.9 to 429.9 ℃. The second thermal decomposition from 429.9 to 800 ℃ caused a 37.8% weight loss, leaving no final residual. In both samples, the polymers broke and side-chain fragments were separated in the first pyrolysis step, and the pyrrolidine rings decomposed in the second step. This two-step decomposition process is consistent with the typical thermal decomposition behavior of polyDDA.37,38 The onsets of the first and second thermal decomposition of the CPDs were 26.1 and 9.1 ℃ higher, respectively, than those of polyDDA. This result indicates that the CPDs had a higher thermal stability than polyDDA, because polyDDA formed CQDs through carbonization via hydrothermal synthesis. The residuals in polyDDA appeared to be from chloride, which was removed from the CPDs during the purification process.
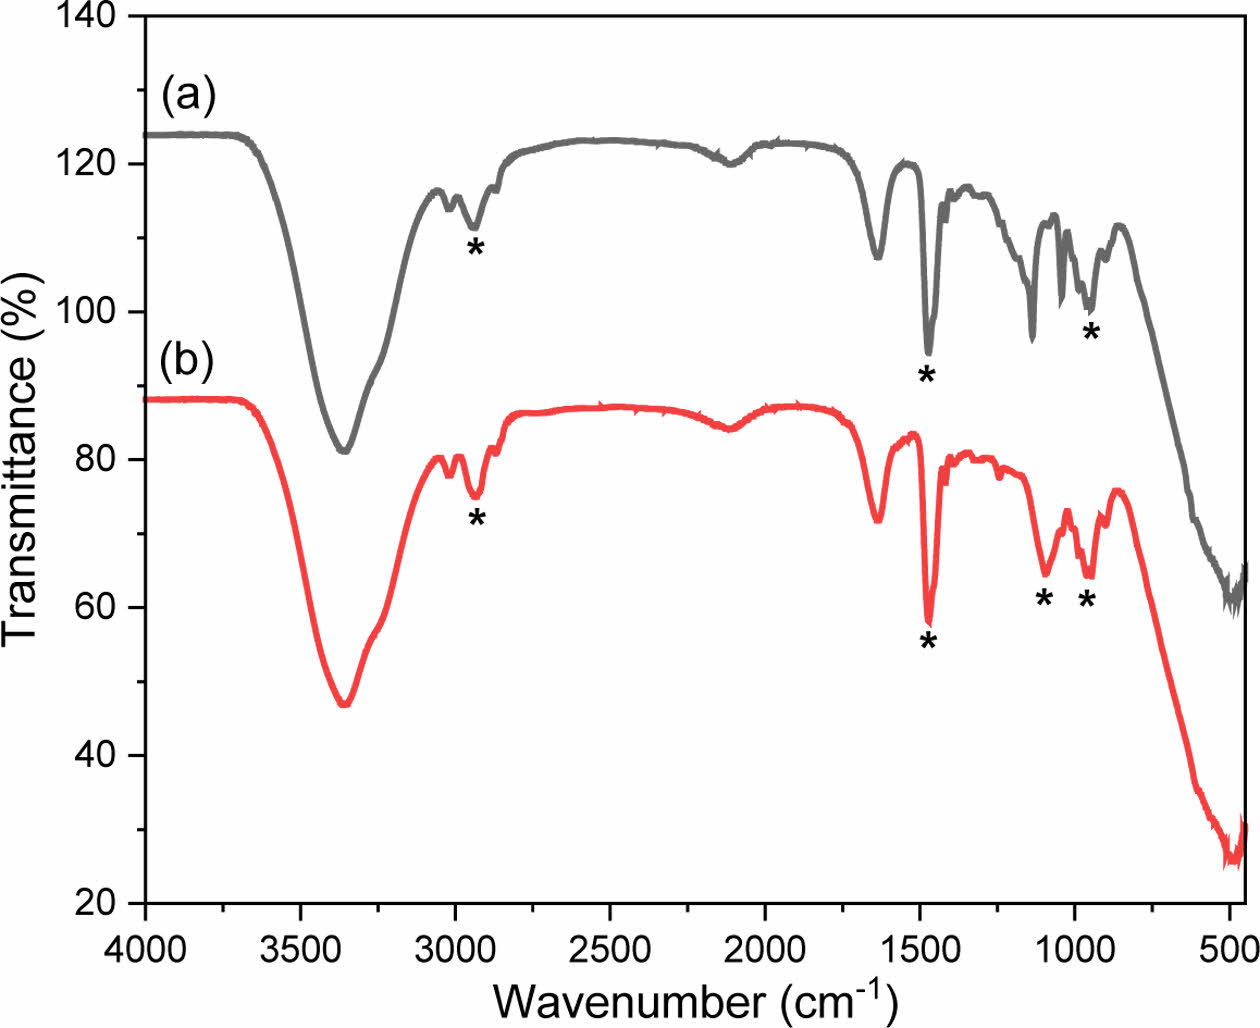
The chemical bonding states of polyDDA and the CPDs were analyzed using FTIR spectroscopy to verify the successful synthesis of the CPDs (Figure 4). The attenuated total reflection method with a diamond crystal module was used for the measurement. PolyDDA had a N+–R4 vibration peak at 961 cm−1 and CH2 and CH3 vibration peaks at 2938 and 1472 cm−1, respectively. The CPDs had similar peaks and a C–N vibration peak at 1093 cm−1, indicating carbon core formation via the carbonization reaction.39 The CPDs were prepared using polyDDA as the sole precursor, which preserved the amine groups without degradation. These results confirm that CPDs with a carbon core and an amine functional group were successfully synthesized via a partial carbonization process.
The elemental composition and surface bonding state of the CPDs were confirmed by the XPS spectrum of carbon, oxygen, and nitrogen, and the result is shown in the Supporting Information (Figure S3). The XPS survey spectrum of the CPDs showed C1s, N1s, and O1s at binding energies of 286.1, 402.1, and 532.0 eV, respectively. The atomic percentages of carbon, nitrogen, and oxygen were 85.24%, 6.92%, and 7.85%, respectively. The XPS analysis revealed high nitrogen and oxygen contents, indicating that the functional groups were preserved during the carbonization process. This result is consistent with the FTIR results.
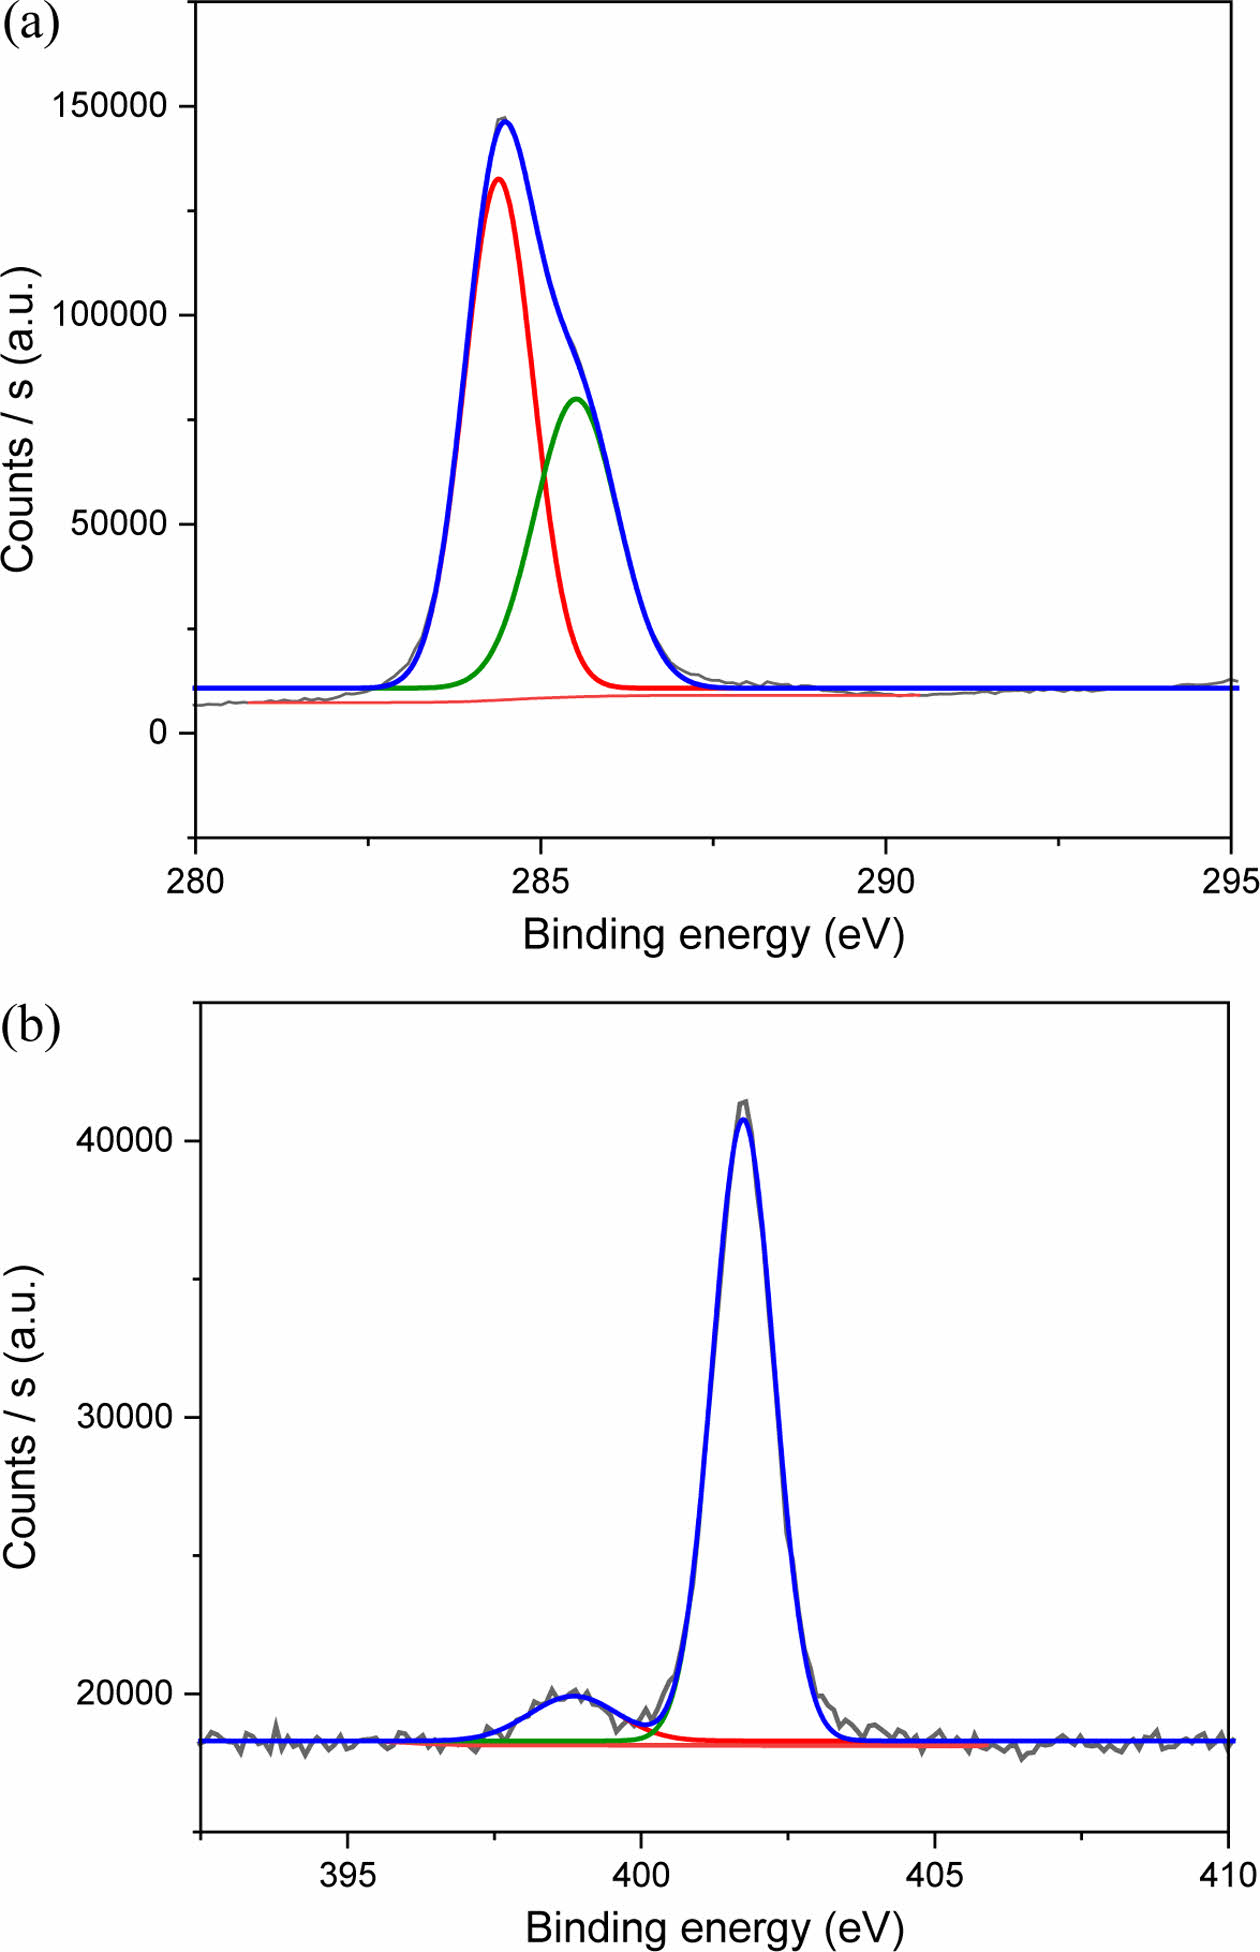
The chemical bonds constituting CPDs were confirmed using high-resolution X-ray photoelectron spectroscopy (HR-XPS) (Figure 5). The C1s HR-XPS spectrum of the CPDs showed C=C and C–C bond energies of 284.4 and 285.5 eV, respectively. The N1s HR-XPS spectrum exhibited a pyridine-based C–N=C bond energy (398.9 eV) and pyrrolidine-based N+–R4 bond energy (401.7 eV). The C–N=C binding energy peak indicated that a CQD core was produced, and the N+–R4 binding energy peak indicated that the functional group was preserved during the carbonization process. Thus, the FTIR and XPS results confirm that the prepared CPDs primarily comprised carbon, and its surface contained quaternary ammonium, which could act as a functional group.
Fluorescence Experiments. To investigate the excitation wavelength dependence of the CPDs, the emission wavelength was measured while increasing the excitation wavelength by 20 nm, from 310 to 490 nm, and the results are shown in the Supporting Information (Figure S4). The CPDs exhibited a single emission wavelength. As the excitation wavelength increased, the maximum emission wavelength shifted to a longer wavelength region, indicating that the emission wavelength of the CPDs was dependent on the excitation wavelength.
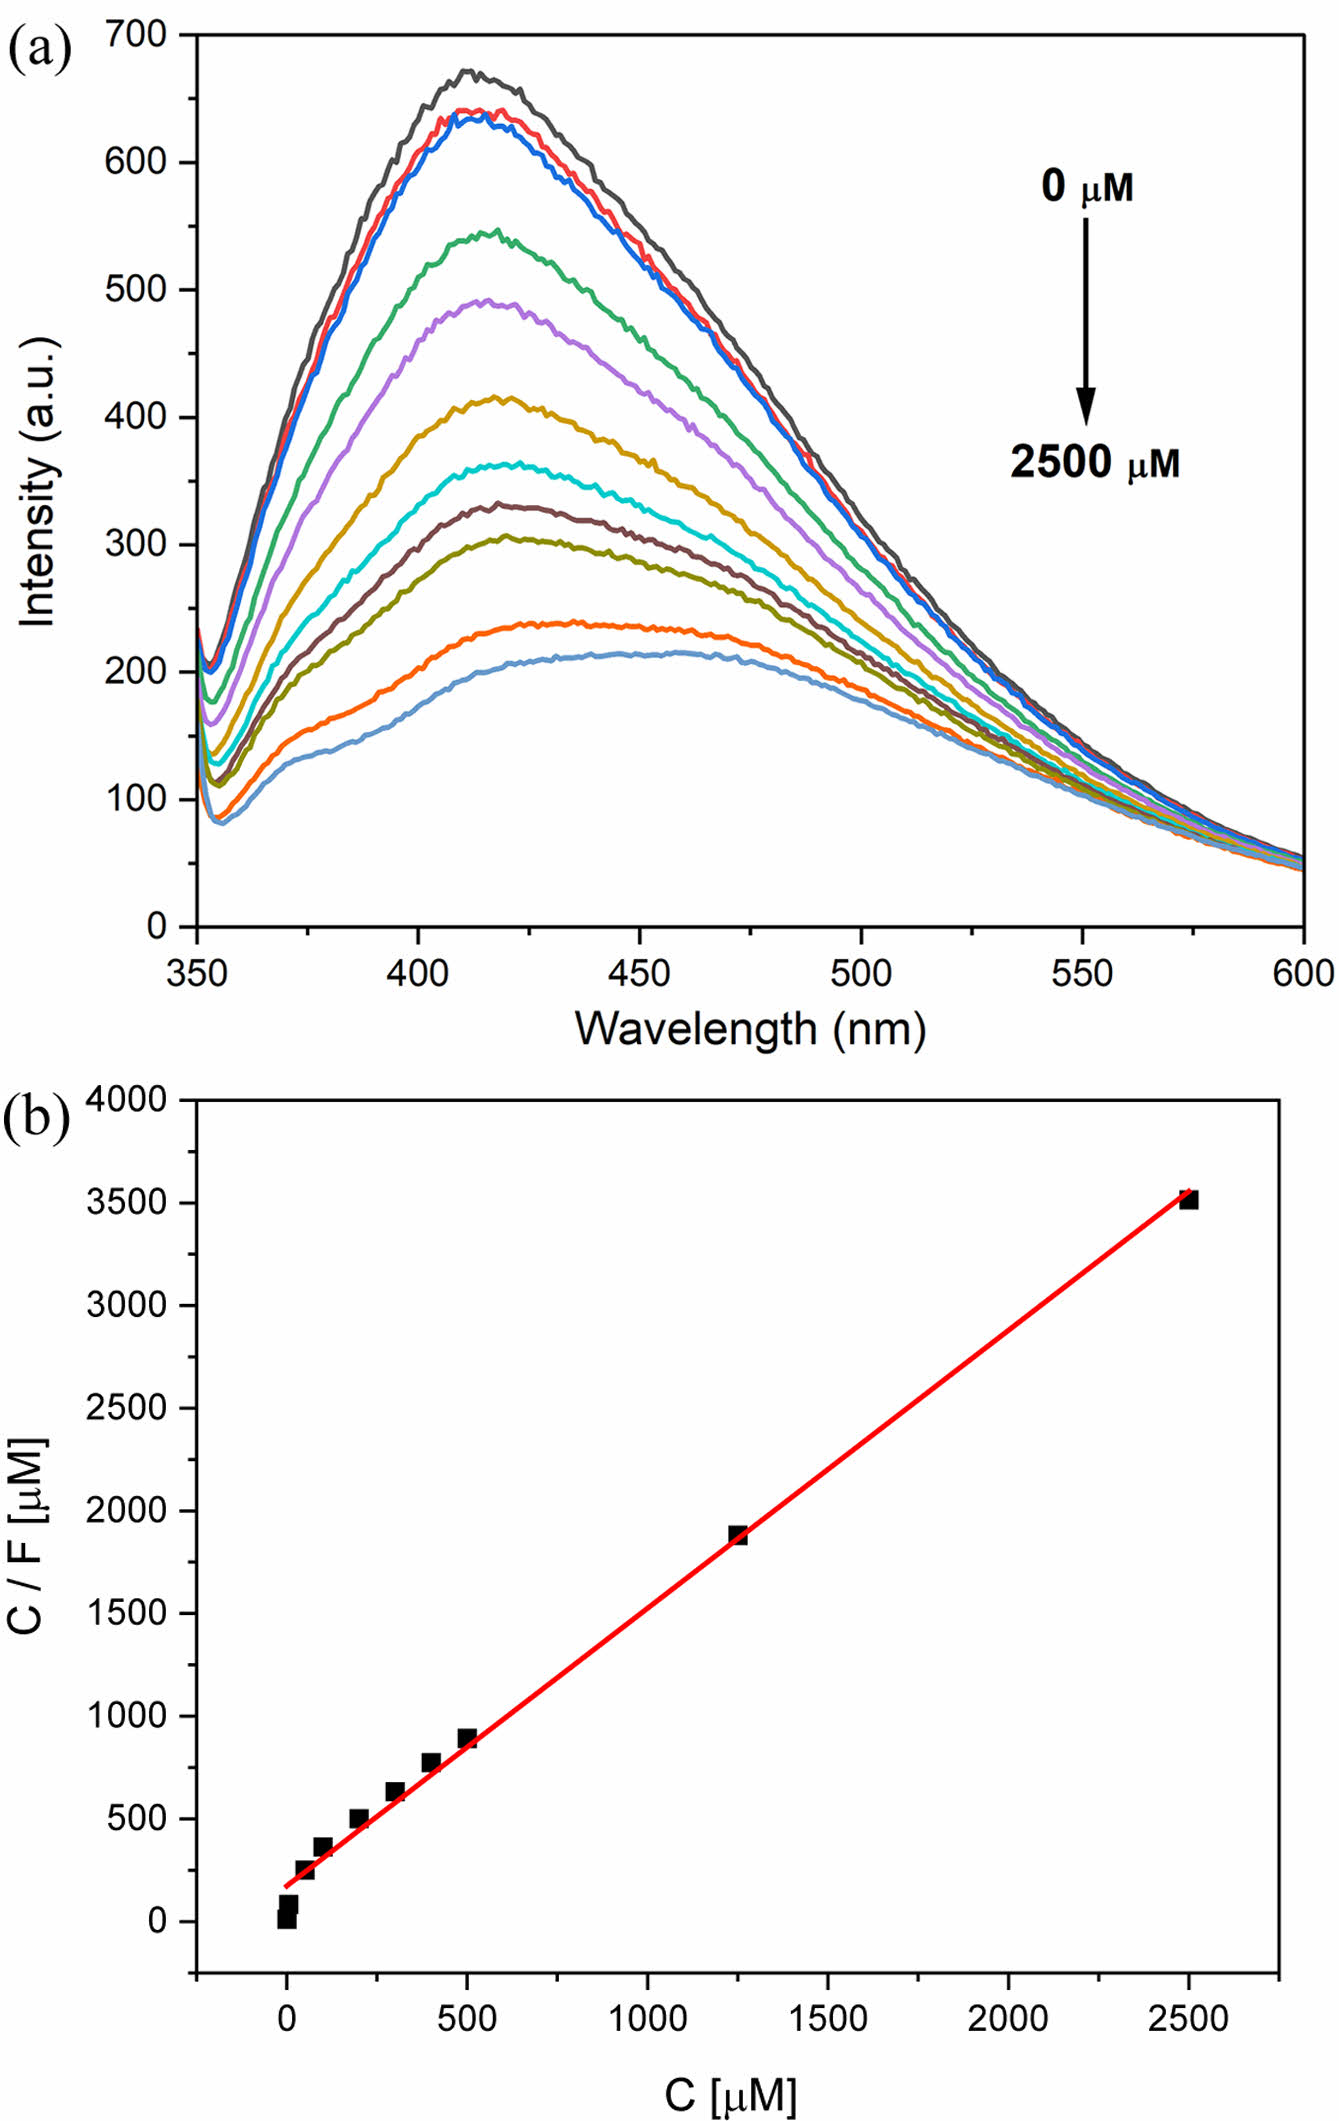
The fluorescence intensity of the CPDs as a function of the perrhenate anion concentration in an aqueous solution is shown in Figure 6. Perrhenate anions absorb light at wavelengths ˂ 300 nm.32 Therefore, the excitation wavelength chosen was 330 nm, which showed the strongest fluorescence emission intensity and did not cause an inner filter effect by the perrhenate anions (Figure S4). The CPD concentration was fixed at 250 ppm, and the perrhenate anion concentration was varied from 0 to 2500 μM. The fluorescence emission intensity decreases with increasing perrhenate anion concentration, as shown in Figure 6(a). The fluorescence intensity change ratio, F (=1–f/f0), was obtained at an emission wavelength of 410 nm, where f is the fluorescence intensity of the perrhenate anions in aqueous solution, and f0 is the fluorescence intensity without perrhenate anions. The fluorescence emission intensity change ratios of the CPDs followed the Langmuir isotherm model (Equation (1)).40,41

Here, C is the perrhenate anion concentration in the aqueous phase (μM), Fm is the maximum fluorescence intensity change ratio, and K is the Langmuir constant (μM−1). This equation can be linearized as shown in Eq. (2).

The results from the experiment were plotted using this linear equation, as shown in Figure 6(b). The graph had a high R2 value of 0.995, confirming that the CPD fluorescence emission intensity change ratio and perrhenate anion concentration follow the Langmuir isotherm model. The maximum fluorescence change ratio Fm was 0.885, and the Langmuir constant K was 0.00652 μM−1. The limit of detection (LOD) for the perrhenate anion by the CPDs was calculated from 3σ/S, where σ is the standard deviation of the blank experiment and S is the slope of the fluorescence intensity change ratio versus the perrhenate anion concentration. The corresponding values are 0.00459 and 1.35, respectively. The LOD was 0.0102 μM, which is relatively low compared to the detection limits reported in previous studies.6,30-32 The comparison of the performance of the CPD with that of other sensors for detecting perrhenate anion is shown in the Supporting Information (Table S1).
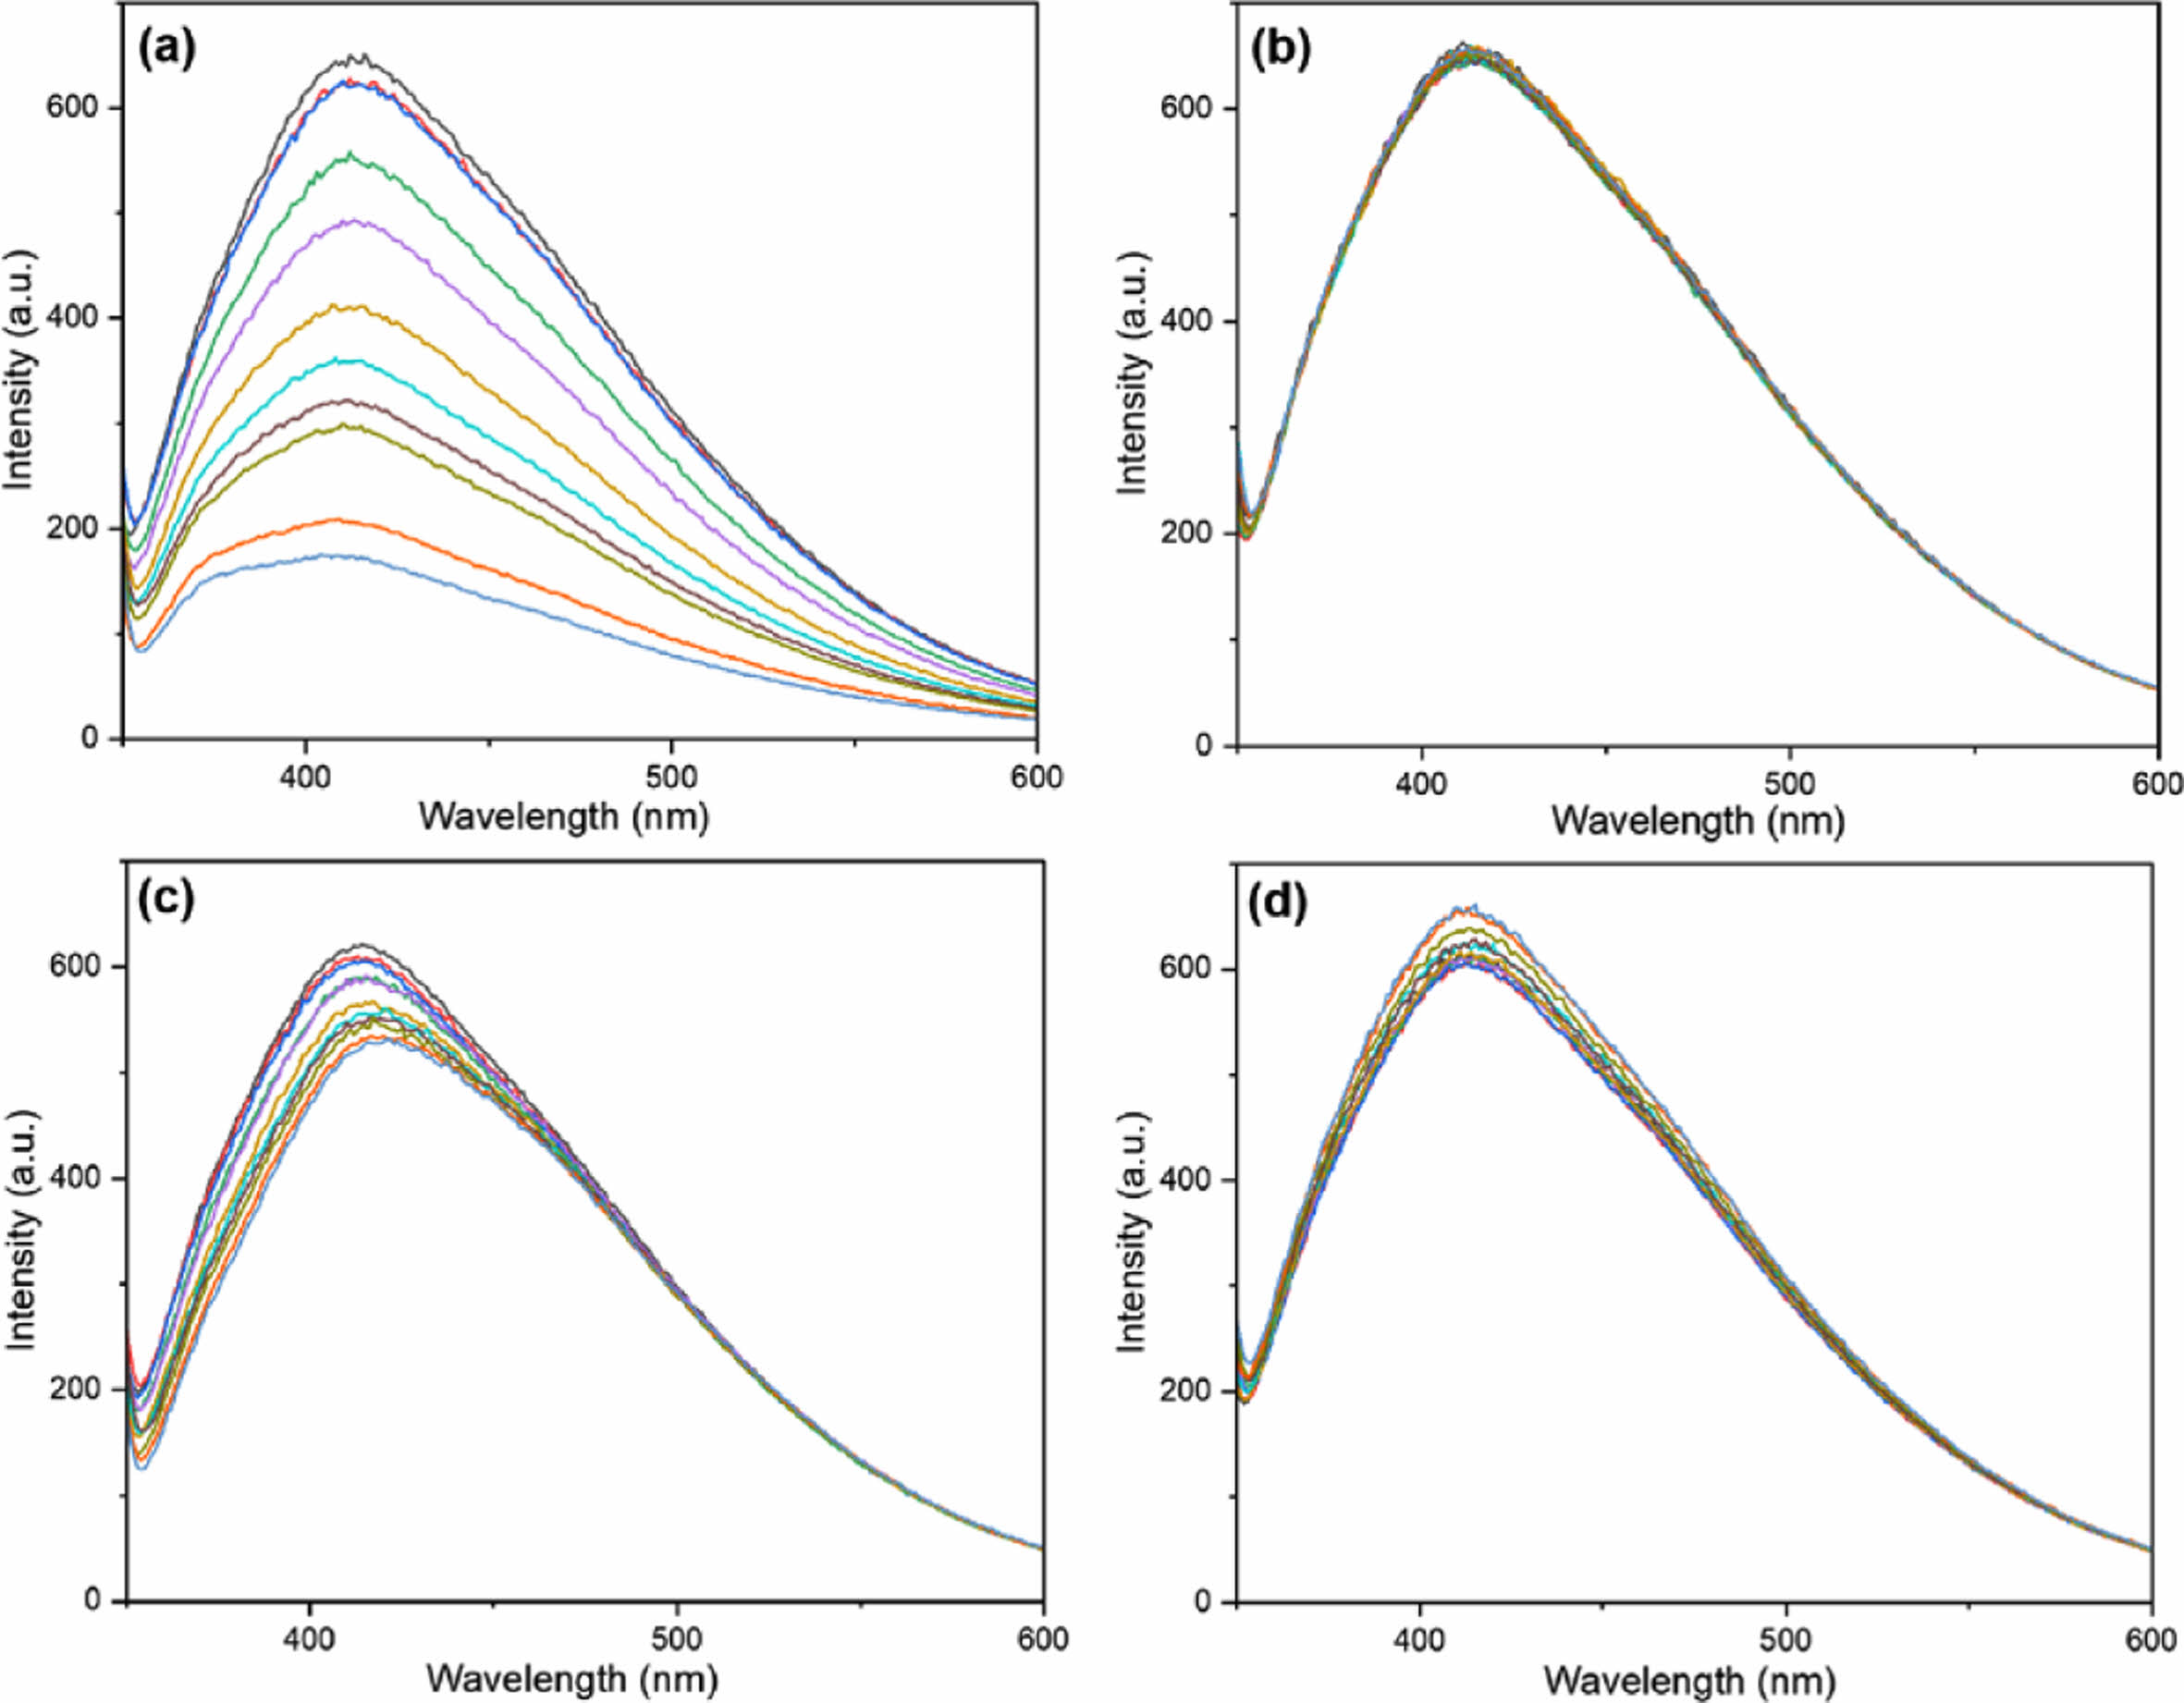
The fluorescence changes in the CPDs for different types of anions were measured to compare their characteristics. Iodide, chloride, nitrate, and sulfate anions were used in the experiment. All anions emitted the strongest fluorescence at 410 nm when excited with 330 nm light, similar to the previous experiment on perrhenate anions. As shown in Figure 7, chloride, nitrate, and sulfate anions show almost no decrease in fluorescence intensity. However, the iodide anion showed a significant decrease in the fluorescence intensity, similar to that of the perrhenate anion (Figure 7(a)). This decrease in fluorescence intensity for iodide and perrhenate anions can be explained by the hard-soft acid-base (HSAB) theory. According to this theory, chemicals with similar properties have stronger affinities for each other.42 Generally, hard acids or bases have small sizes, high effective nuclear charges, and low polarizability, whereas soft acids or bases have the opposite properties. The CPDs used in this study were prepared using polyDDA as the precursor, and contained a carbon core and amine functional groups. The quaternary ammonium functional group (N+–R4) is a large, positively charged functional group. Therefore, CPDs had a high affinity for iodide and perrhenate anions, which are relatively large soft-bases. Moreover, CPDs had a low affinity for hard base anions, such as chloride, nitrate, and sulfate.
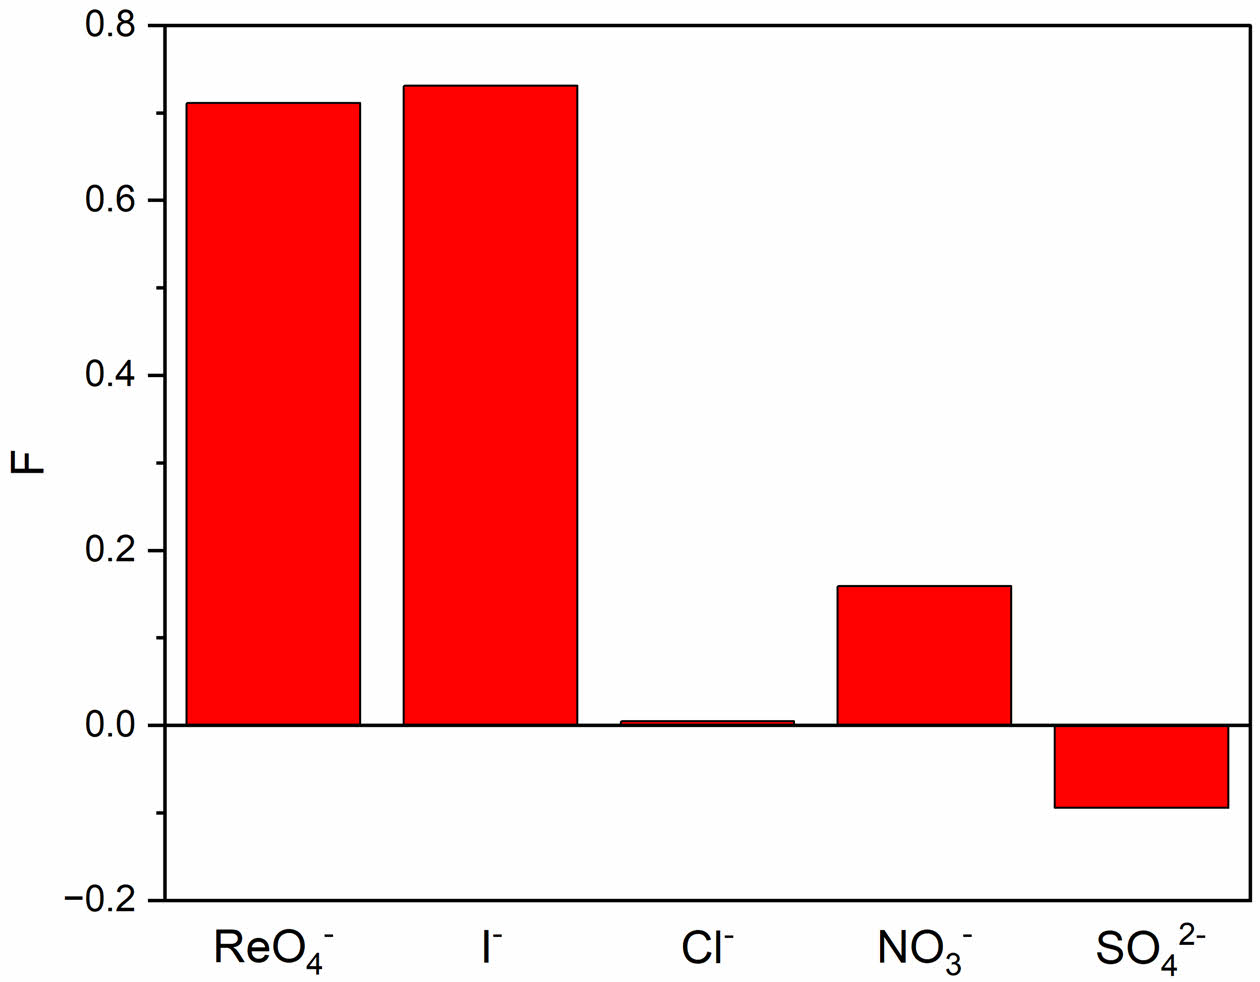
The maximum fluorescence change ratios for the different types of anions were compared, as shown in Figure 8. The same excitation wavelength of 330 nm was used, and the fluorescence change ratio at 410 nm, which is the maximum emission wavelength, was measured. The CPD and anion concentrations were 250 ppm and 2500 μM, respectively. The measurement results showed that the fluorescence change ratios for perrhenate and iodide anions were 0.71 and 0.73, respectively, which are consistent with the HSAB theory. The fluorescence change ratios for chloride, nitrate, and sulfate anions were 0.0045, 0.16, and −0.094, respectively, which were extremely small.
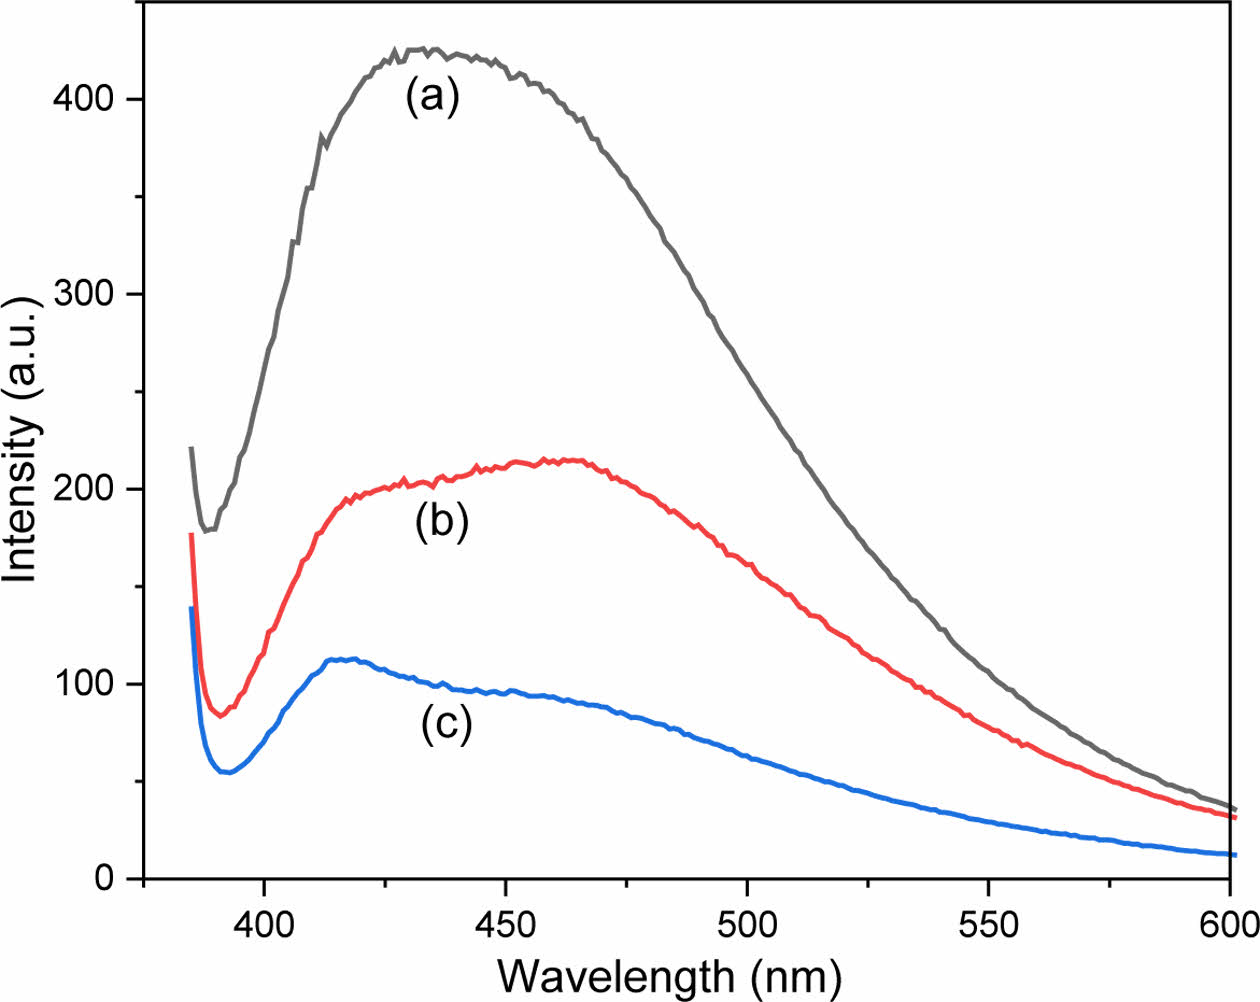
The effect of anions on the fluorescence color change of the CPDs in aqueous solution was examined. A fluorescence photograph was captured after the CPD solution mixed with each anion was excited using a 365 nm UV lamp. The concentrations of the CPDs and anions were 250 ppm and 2500 μM, respectively. As shown in Figure 9, the fluorescence of the CPDs did not change in the presence of chloride, nitrate, and sulfate anions, compared to that in distilled water. These results are consistent with the experimental results abovementioned. However, for the perrhenate anion, the fluorescence of the CPDs changed from blue to cyan (Figure 9(b)). For the iodide anion, the fluorescence color did not change, but the overall fluorescence decreased, and quenching occurred (Figure 9(c)). To further investigate the difference in fluorescence characteristics between the perrhenate and iodide anions, the change in fluorescence intensity at an excitation wavelength of 365 nm was measured, and the results are shown in Figure 10. Similar to the previous experiment, the concentrations of the CPDs and anions were 250 ppm and 2500 μM, respectively. As shown in Figure 10(c), the iodide anion decreases the overall fluorescence intensity across all wavelength regions. However, for the perrhenate anion, the decrease in fluorescence intensity was relatively small at 470 nm, which is within the green wavelength range, whereas the fluorescence intensity considerably decreased at 410 nm, which is within the blue wavelength range (Figure 10(b)). Accordingly, the perrhenate anion exhibited a more pronounced reduction in fluorescence intensity at 410 nm compared to 470 nm, resulting in a shift from blue to cyan in the observed coloration. This suggests that the fluorescence emission wavelength region of the CPDs varies depending on the anion, thus resulting in different fluorescence characteristics for the perrhenate and iodide anions. This result implies that CPD can be used to selectively detect perrhenate anions.
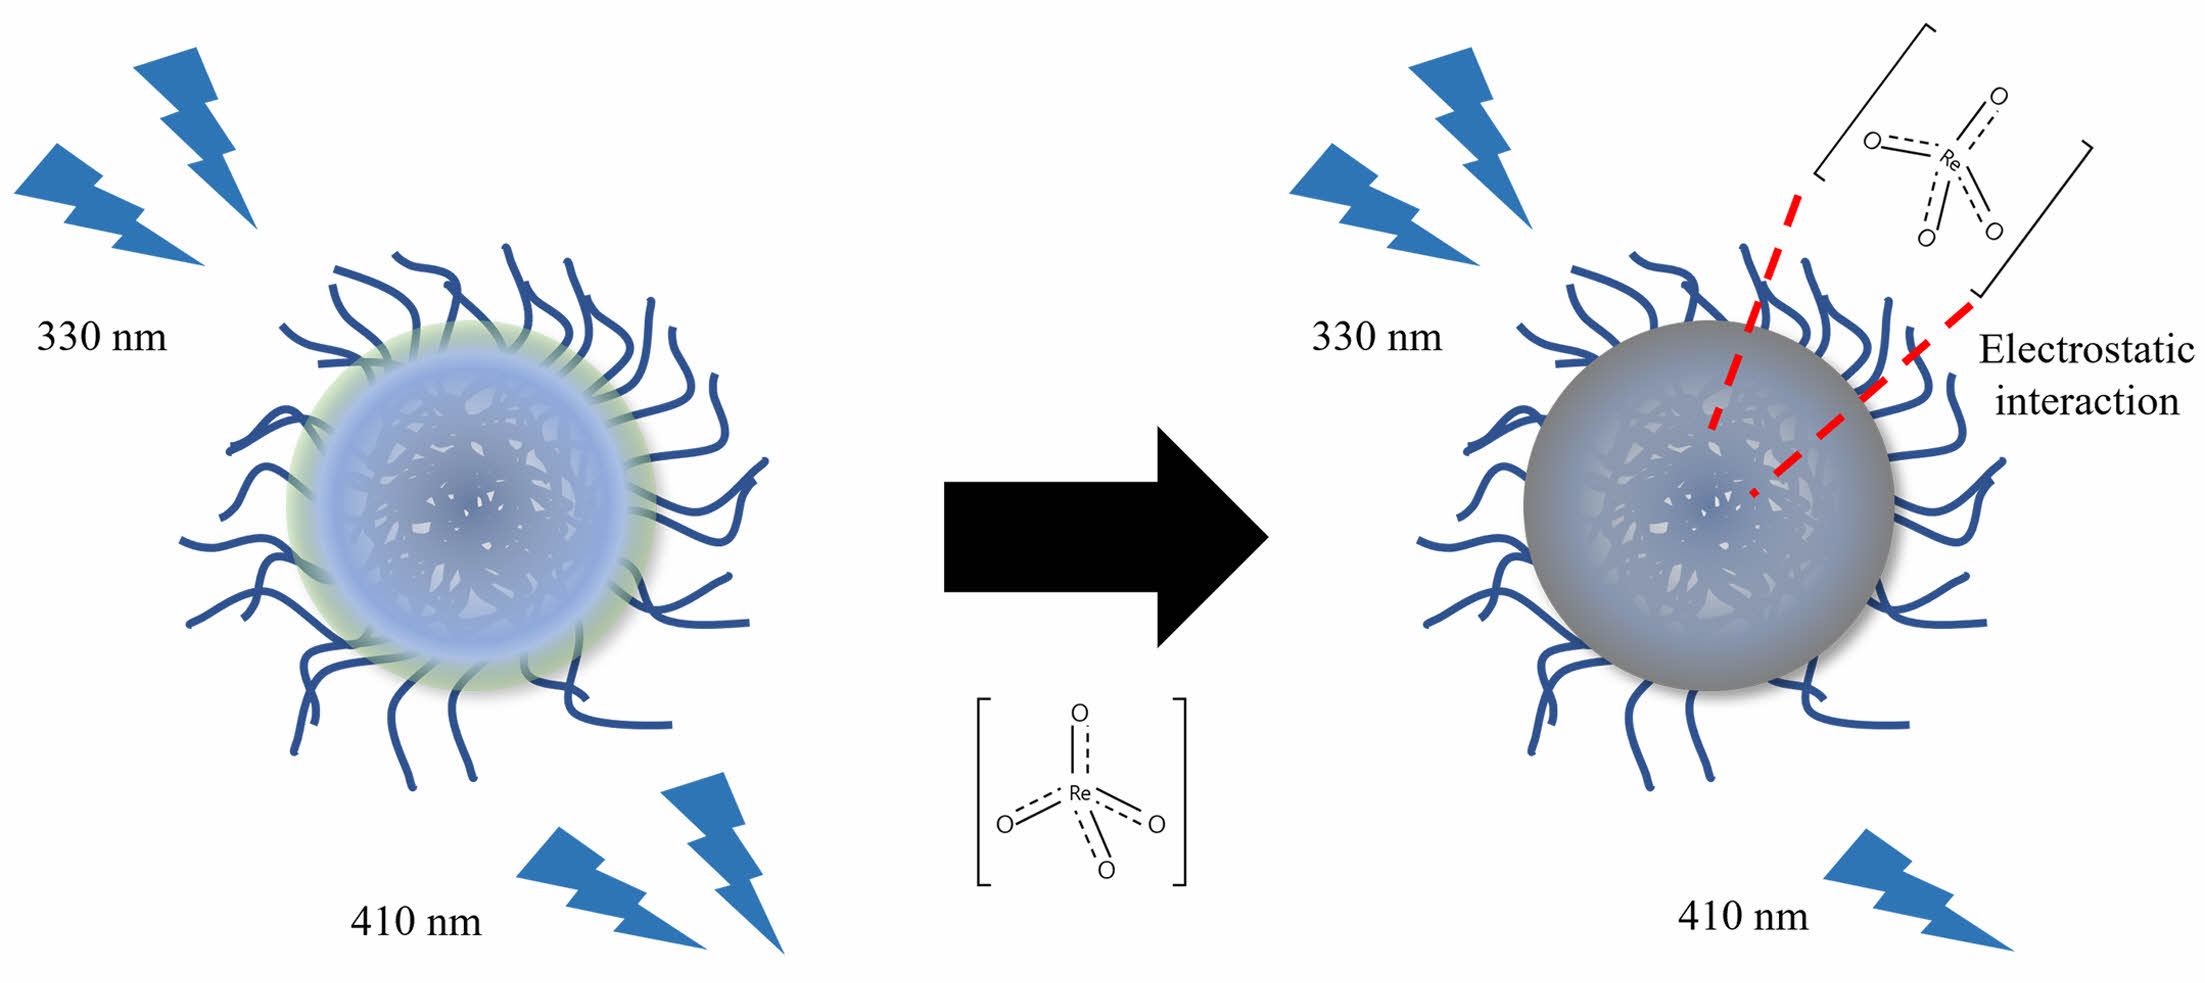
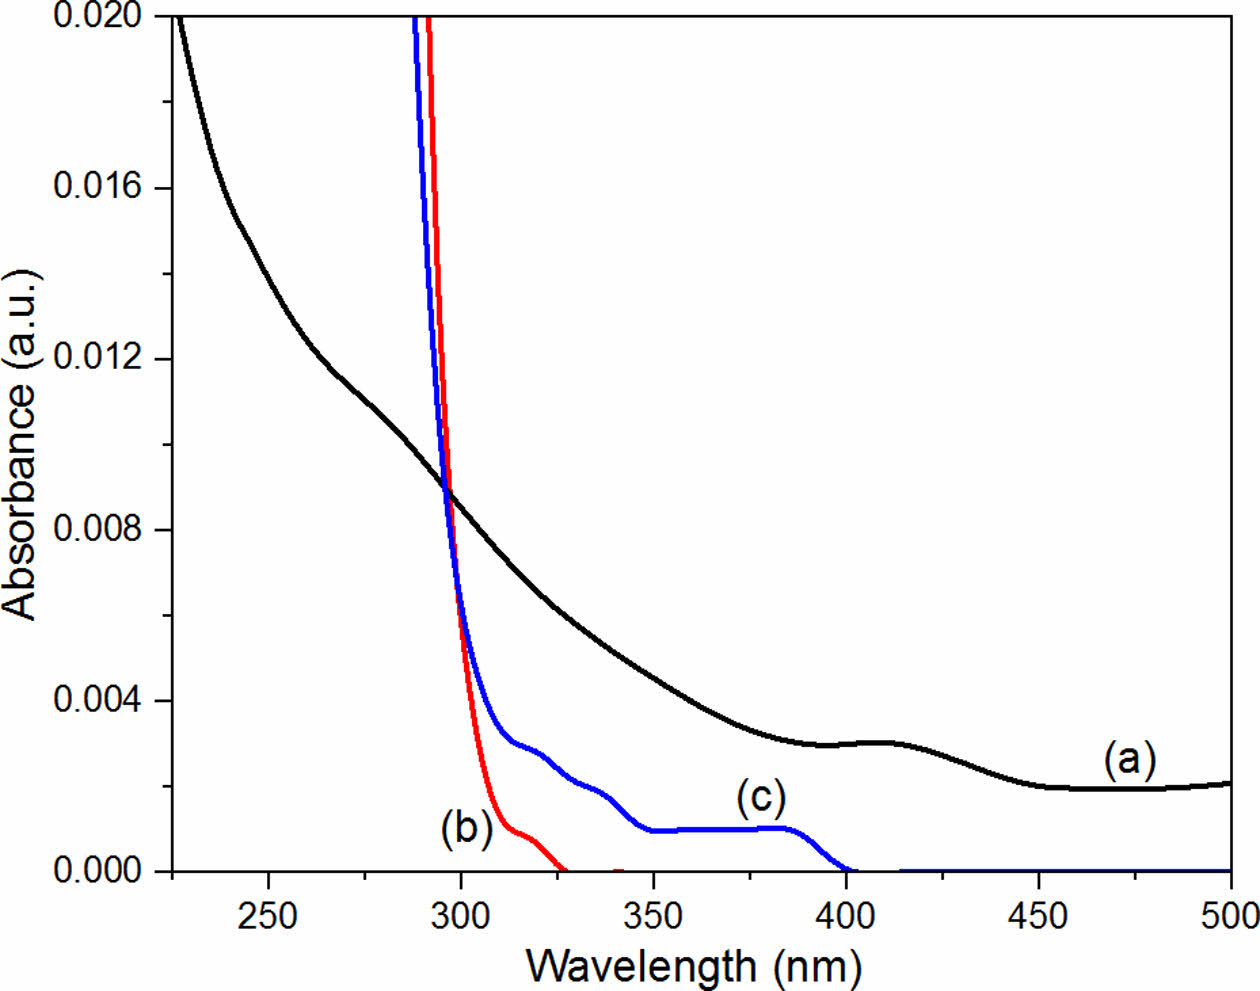
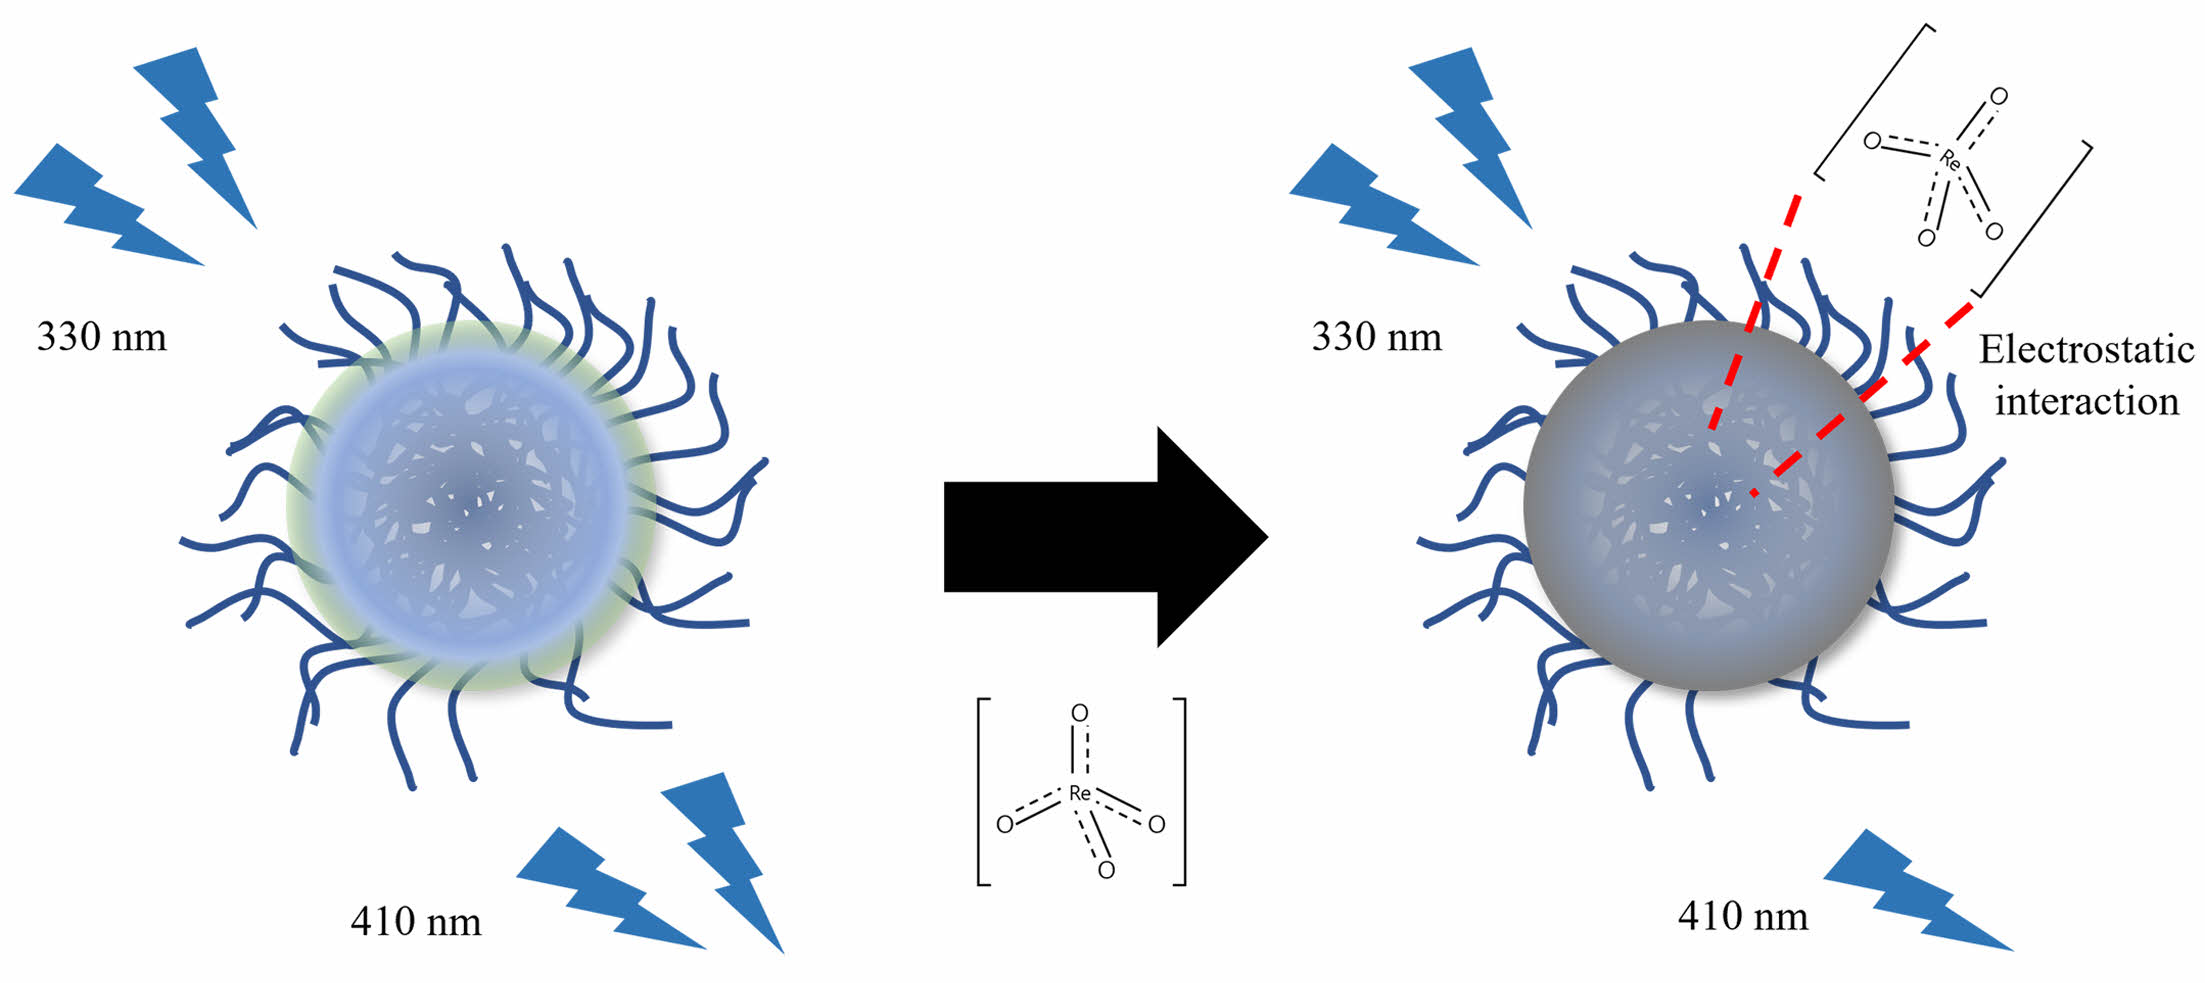
To determine how the perrhenate anion quenched the CPDs, three solutions were prepared: CPD aqueous solution (250 ppm), perrhenate anion aqueous solution (2500 μM), and CPD aqueous solution (250 ppm) with the perrhenate anion (2500 μM). UV-Vis spectroscopy was used to measure the absorbance of each solution (Figure 11). The absorbance of the mixed solution of CPDs and perrhenate anions was lower than that of pure CPDs. These results suggest that static quenching occurs when the CPDs and perrhenate anions, which have opposite surface charges, form nonfluorescent complexes via electrostatic interactions. Figure 12 shows a schematic diagram of how the CPDs detect perrhenate anions using this static quenching mechanism.
|
Figure 1 Field emission transmission electron microscopy image of the prepared CPDs. |
|
Figure 2 X-ray diffraction pattern of the prepared CPDs. |
|
Figure 3 Zeta potential distribution of the prepared CPDs. |
|
Figure 4 Fourier-transform infrared spectroscopy spectra of (a) polyDDA; (b) CPDs. |
|
Figure 5 HR-XPS spectra of (a) C1s; (b) N1s of the CPDs. |
|
Figure 6 (a) Fluorescence intensity changes of the CPDs; (b) linear line fitted with the Langmuir isotherm model of the fluorescence intensity change ratio with the change in perrhenate anion concentrations. |
|
Figure 7 Fluorescence intensity changes of the CPDs according to the anion species: (a) I− ; (b) Cl− ; (c) NO3 − ; (d) SO4 2−. |
|
Figure 8 Fluorescence intensity change ratios according to the anion species ReO4 − , I− , Cl− , NO3 − , and SO4 2− at an excitation wavelength of 330 nm. |

|
Figure 9 Fluorescence photos of the CPDs according to anion species: (a) distilled water; (b) ReO4 − ; (c) I− ; (d) Cl− , (e) NO3 − ; (f) SO4 2− at an excitation wavelength of 365 nm. |
|
Figure 10 Fluorescence intensity changes of the CPDs: (a) distilled water; (b) perrhenate; (c) iodide anions at excitation wavelength of 365 nm. |
|
Figure 11 Ultraviolet-visible (UV-Vis) absorbance spectra of (a) CPD aqueous solution (250 ppm); (b) CPD aqueous solution (250 ppm) with perrhenate anion (2500 μM); (c) perrhenate anion aqueous solution (2500 μM). |
|
Figure 12 Schematic of the fluorescence quenching mechanism of the CPDs and perrhenate anions. |
CPDs, with a positive surface charge, were prepared via hydrothermal synthesis using polyDDA, a cationic polymer, as the precursor for the detection of perrhenate anions in aqueous solutions. The CPDs formed a stable cationic colloid with a surface charge of +33.9 mV and quasi-spherical particles with an average size of 5–8 nm without core-functional group boundaries. The CPDs had a higher thermal stability than its precursor, polyDDA, and primarily comprised a carbon core and a peripheral functional group of N+–R4. The CPDs exhibited excitation dependence, shifting its emission wavelength to longer regions as the excitation wavelength increased, and attained a maximum fluorescence emission intensity at an excitation wavelength of 330 nm. The fluorescence intensity of the CPDs decreased as the concentration of perrhenate anions increased. The fluorescence intensity change ratio followed the Langmuir isotherm model well, and the detection limit was 0.0102 μM, which is lower than in previous studies. The CPDs had a relatively large, positively charged functional group. Consistent with the HSAB theory, the soft bases (i.e., perrhenate and iodide anions) showed a decrease in fluorescence intensity. The hard bases (i.e., chloride, nitrate, and sulfate anions) did not significantly affect the fluorescence intensity. Moreover, when excited at 365 nm, the iodide anion decreased and quenched the fluorescence intensity over the entire wavelength range of 410–470 nm. However, the perrhenate anion decreased the fluorescence intensity to a greater extent at 410 nm than at 470 nm, changing the color from blue to cyan. This indicates the potential for the selective detection of the perrhenate anion. The positive surface charge of the CPDs likely electrostatically interacted with the perrhenate anion to form a non-fluorescent complex, thereby resulting in static quenching. This study confirmed the detectability of perrhenate anions by CPDs. However, further research is required to develop a material that exhibits a more pronounced fluorescence color change for the perrhenate anion and a brighter fluorescence with a higher quantum yield for the applications of the CPDs in a real-world water environment. Additionally, it is essential to develop a material in which the fluorescence change is linear over a broad range, rather than following a Langmuir isotherm for changes in perrhenate anion concentration.
- 1. Suh, M. Y.; Lee, C. H.; Han, S. H.; Park, Y. J.; Lee, K. Y.; Kim, W. H. Extraction Chromatographic Separation of Technetium-99 from Spent Nuclear Fuels for Its Determination by Inductively Coupled Plasma-Mass Spectrometry. Anal. Sci. Technol. 2004, 17, 438-442.
-

- 2. Chan, W. N.; Warren, J. P.; Krieger, S. P.; Vestal, B. L.; Harrison, R. G. Separation and Preconcentration of Perrhenate from Ionic Solutions by Ion Exchange Chromatography. J. Chromatogr. A 2020, 1631, 461588-461593.
-

- 3. Katayev, E. A.; Kolesnikov, G. V.; Sessler, J. L. Molecular Recognition of Pertechnetate and Perrhenate. Chem. Soc. Rev. 2009, 38, 1572-1586.
-

- 4. Pandey, S. P.; Desai, A. M.; Singh, P. K. A Highly Sensitive Fluorescence “Turn On” Detection of Perrhenate Anion, a Non-Radioactive Surrogate of Hazardous Pertechnetate Anion. Sens. Actuators, B. 2020, 323, 128675-128682.
-

- 5. Li, C. P.; Zhou, H.; Chen, J.; Wang, J. J.; Du, M.; Zhou, W. A Highly Efficient Coordination Polymer for Selective Trapping and Sensing of Perrhenate/Pertechnetate. ACS Appl. Mater. Interfaces 2020, 12, 15246-15254.
-

- 6. Singh, G.; Pandey, S. P.; Singh, P. K. A Dual Intensity and Lifetime Based Fluorescence Sensor for Perrhenate Anion. Sens. Actuators, B. 2021, 330, 129346-129354.
-

- 7. Melton, L. M.; Taylor, M. J.; Flynn, E. E. The Utilisation of Ion Chromatography and Tandem Mass Spectrometry (IC-MS/MS) for the Multi-Residue Simultaneous Determination of Highly Polar Anionic Pesticides in Fruit and Vegetables. Food Chem. 2019, 298, 125028-125035.
-

- 8. Saari-Nordhaus, R.; Anderson Jr., J. M. Recent Advances in Ion Chromatography Suppressor Improve Anion Separation and Detection. J. Chromatogr. A 2002, 956, 15-22.
-

- 9. López-Ruiz, B. Advances in the Determination of Inorganic Anions by Ion Chromatography. J. Chromatogr. A 2000, 881, 607-627.
-

- 10. Colon, M.; Todoli, J. L.; Hidalgo, M.; Iglesias, M. Development of Novel and Sensitive Methods for the Determination of Sulfide in Aqueous Samples by Hydrogen Sulfide Generation-Inductively Coupled Plasma-Atomic Emission Spectroscopy. Anal. Chim. Acta 2008, 609, 160-168.
-

- 11. Zhang, H. Y.; Wang, Y.; Xiao, S.; Wang, H.; Wang, J. H.; Feng, L. Rapid Detection of Cr (VI) Ions Based on Cobalt (II)-Doped Carbon Dots. Biosens. Bioelectron. 2017, 87, 46-52.
-

- 12. Lou, X.; Ou, D.; Li, Q.; Li, Z. An Indirect Approach for Anion Detection: the Displacement Strategy and Its Application. Chem. Commun. 2012, 48, 8462-8477.
-

- 13. Saha, K.; Agasti, S. S.; Kim, C.; Li, X.; Rotello, V. M. Gold Nanoparticles in Chemical and Biological Sensing. Chem. Rev. 2012, 112, 2739-2779.
-

- 14. Liu, Y.; Huang, H.; Cao, W.; Mao, B.; Liu, Y.; Kang, Z. Advances in Carbon Dots: from the Perspective of Traditional Quantum Dots. Mat. Chem. Front. 2020, 4, 1586-1613.
-

- 15. Yuan, F.; Li, S.; Fan, Z.; Meng, X.; Fan, L.; Yang, S. Shining Carbon Dots: Synthesis and Biomedical and Optoelectronic Applications. Nano Today 2016, 11, 565-586.
-

- 16. Bacon, M.; Bradley, S. J.; Nann, T. Graphene Quantum Dots. Part. Part. Syst. Charact. 2014, 31, 415-428.
-

- 17. Yan, F.; Sun, Z.; Zhang, H.; Sun, X.; Jiang, Y.; Bai, Z. The Fluorescence Mechanism of Carbon Dots, and Methods for Tuning Their Emission Color: A Review. Microchim. Acta 2019, 186, 583-619.
-

- 18. Mansuriya, B. D.; Altintas, Z. Carbon Dots: Classification, Properties, Synthesis, Characterization, and Applications in Health Care – An Updated Review (2018–2021). Nanomaterials 2021, 11, 2525-2579.
-

- 19. Zhu, S.; Song, Y.; Zhao, X.; Shao, J.; Zhang, J.; Yang, B. The Photoluminescence Mechanism in Carbon Dots (Graphene Quantum Dots, Carbon Nanodots, and Polymer Dots): Current State and Future Perspective. Nano Res. 2015, 8, 355-381.
-

- 20. Langer, M.; Paloncýová, M.; Medveď, M.; Pykal, M.; Nachtigallová, D.; Shi, B.; Otyepka, M. Progress and Challenges in Understanding of Photoluminescence Properties of Carbon Dots Based on Theoretical Computations. Appl. Mater. Today 2021, 22, 100924-100951.
-

- 21. Kwon, B.; Jeong, G.; Jeong, W.; Park, J.; Chae, A.; In, I. Recent Trends in Synthesis and Application of Carbon Quantum Dots. Polymer Sci. Technol. 2018, 29, 297-303.
- 22. Tian, P.; Tang, L.; Teng, K. S.; Lau, S. P. Graphene Quantum Dots from Chemistry to Applications. Mater. Today Chem. 2018, 10, 221-258.
-

- 23. Xia, C.; Zhu, S.; Feng, T.; Yang, M.; Yang, B. Evolution and Synthesis of Carbon Dots: From Carbon Dots to Carbonized Polymer Dots. Adv. Sci. 2019, 6, 1901316-1901338.
-

- 24. Zheng, L.; Chi, Y.; Dong, Y.; Lin, J.; Wang, B. Electrochemiluminescence of Water-soluble Carbon Nanocrystals Released Electrochemically from Graphite. J. Am. Chem. Soc. 2009, 131, 4564-4565.
-

- 25. Gonçalves, H.; Jorge, P. A.; Fernandes, J. R. A.; da Silva, J. C. E. Hg (II) Sensing Based on Functionalized Carbon Dots Obtained by Direct Laser Ablation. Sens. Actuators, B. 2010, 145, 702-707.
-

- 26. Dey, S.; Govindaraj, A.; Biswas, K.; Rao, C. N. R. Luminescence Properties of Boron and Nitrogen Doped Graphene Quantum Dots Prepared from Arc-Discharge-Generated Doped Graphene Samples. Chem. Phys. Lett. 2014, 595, 203-208.
-

- 27. de Medeiros, T. V.; Manioudakis, J.; Noun, F.; Macairan, J. R.; Victoria, F.; Naccache, R. Microwave-Assisted Synthesis of Carbon Dots and Their Applications. J. Mater. Chem. C 2019, 7, 7175-7195.
-

- 28. Li, H.; He, X.; Liu, Y.; Huang, H.; Lian, S.; Lee, S. T.; Kang, Z. One-Step Ultrasonic Synthesis of Water-Soluble Carbon Nanoparticles with Excellent Photoluminescent Properties. Carbon 2011, 49, 605-609.
-

- 29. Mehta, V. N.; Jha, S.; Basu, H.; Singhal, R. K.; Kailasa, S. K. One-Step Hydrothermal Approach to Fabricate Carbon Dots from Apple Juice for Imaging of Mycobacterium and Fungal Cells. Sens. Actuators, B. 2015, 213, 434-443.
-

- 30. Desai, A. M.; Singh, P. K. Ratiometric Fluorescence Turn-On Sensing of Perrhenate Anion, a Non-Radioactive Surrogate of Hazardous Pertechnetate, in Aqueous Solution. Sens. Actuators, B. 2018, 277, 205-209.
-

- 31. Desai, A. M.; Singh, P. K. An Ultrafast Molecular-Rotor-Based Fluorescent Turn-On Sensor for the Perrhenate Anion in Aqueous Solution. Chem. Eur. J. 2019, 25, 2035-2042.
-

- 32. Choi, M. R.; Lee, B. Synthesis of Cationic Carbon Quantum Dot-Based Dual Emission Fluorescence Sensor for Detecting Perrhenate Anions in Aqueous Solutions. Opt. Mater. 2022, 134, 113190-113200.
-

- 33. Song, Y.; Zhu, S.; Shao, J.; Yang, B. Polymer Carbon Dots–A Highlight Reviewing Their Unique Structure, Bright Emission and Probable Photoluminescence Mechanism. J. Polym. Sci. Pol. Chem. 2017, 55, 610-615.
-

- 34. He, X.; Chen, P.; Zhang, J.; Luo, T. Y.; Wang, H. J.; Liu, Y. H.; Yu, X. Q. Cationic Polymer-Derived Carbon Dots for Enhanced Gene Delivery and Cell Imaging. Biomater. Sci. 2019, 7, 1940-1948.
-

- 35. Du, L.; Zhang, S.; Chen, G.; Yin, G.; Du, C.; Tan, Q.; Sun, Y.; Qu, Y.; Gao, Y. Polyelectrolyte Assisted Synthesis and Enhanced Oxygen Reduction Activity of Pt Nanocrystals with Controllable Shape and Size. ACS Appl. Mater. Interfaces 2014, 6, 14043-14049.
-

- 36. Kłodzińska, E.; Szumski, M.; Dziubakiewicz, E.; Hrynkiewicz, K.; Skwarek, E.; Janusz, W.; Buszewski, B. Effect of Zeta Potential Value on Bacterial Behavior During Electrophoretic Separation. Electrophoresis 2010, 31, 1590-1596.
-

- 37. Francis, S.; Varshney, L.; Sabharwal, S. Thermal Degradation Behavior of Radiation Synthesized Polydiallyldimethylammonium Chloride. Eur. Polym. J. 2007, 43, 2525-2531.
-

- 38. Celestino, G. G.; Henriques, R. R.; Shiguihara, A. L.; Constantino, V. R.; de Siqueira Melo, R.; Amim Júnior, J. Adsorption of Gallic Acid on Nanoclay Modified with Poly (Diallyldimethylammonium Chloride). Environ. Sci. Pollut. Res. 2019, 26, 28444-28454.
-

- 39. Lin, C. J.; Unnikrishnan, B.; Lehman, C. W.; Wang, P. H.; Tseng, Y. J.; Harroun, S. G.; Huang, C. C. Exploring Molecular Moieties on Carbonized Polymer Dots from Flavonoid Glycosides with Activity against Enterovirus A71. Carbon 2022, 192, 285-294.
-

- 40. Jeppu, G. P.; Clement, T. P. A Modified Langmuir-Freundlich Isotherm Model for Simulating pH-Dependent Adsorption Effects. J. Contam. Hydrol. 2012, 129, 46-53.
-

- 41. Azizian, S.; Haerifar, M.; Basiri-Parsa, J. Extended Geometric Method: A Simple Approach to Derive Adsorption Rate Constants of Langmuir–Freundlich Kinetics. Chemosphere 2007, 68, 2040-2046.
-

- 42. Ho, T. L. Hard Soft Acids Bases (HSAB) Principle and Organic Chemistry. Chem. Rev. 1975, 75, 1-20.
-

- Polymer(Korea) 폴리머
- Frequency : Bimonthly(odd)
ISSN 2234-8077(Online)
Abbr. Polym. Korea - 2024 Impact Factor : 0.6
- Indexed in SCIE
 This Article
-
2025; 49(2): 170-180
Published online Mar 25, 2025
- 10.7317/pk.2025.49.2.170
- Received on Jul 9, 2024
- Revised on Dec 15, 2024
- Accepted on Dec 16, 2024
 Services
- Full Text PDF
- Abstract
- ToC
- Acknowledgements
- Conflict of Interest
- Supporting Information
Introduction
Experimental
Results and Discussion
Conclusions
- References
Shared
 Correspondence to
- Byunghwan Lee
-
Department of Chemical Engineering, Keimyung University, 1095 Dalgubeoldaero, Dalseo-gu, Daegu 42601, Korea
- E-mail: leeb@kmu.ac.kr
- ORCID:
0000-0001-7523-829X


 Copyright(c) The Polymer Society of Korea. All right reserved.