- Influence of Water Content on the Structural Evolution of PA6 Cast Film During Stretching Uniaxial Process
*Chongqing Industry Polytechnic College, Chongqing 401120, China
**State Key Laboratory of Polymer Materials Engineering, Polymer Research Institute of Sichuan University, Chengdu 610065, China- 일축 인장 공정 중에서 PA6 주조 필름의 수분 함량이 구조적 변화에 미치는 영향
Reproduction, stored in a retrieval system, or transmitted in any form of any part of this publication is permitted only by written permission from the Polymer Society of Korea.
In this study, the diffusion process of water molecules in polyamide 6 (PA6) films was investigated using time-dependent infrared spectroscopy. PA6 films with different water contents were prepared, and the influence of water on microstructure of PA6 was investigated using thermogravimetric analyzer (TGA), X-ray diffraction (XRD) and differential scanning calorimetry (DSC). PA6 films with different water contents were stretched to different strains, and DSC, XRD, polarized infrared spectroscopy and 2D-SAXS were used to investigate the structural evolution of these samples during stretching. Results revealed that the diffusion of water molecules in PA6 film disrupts the hydrogen bonding between PA6 molecular chains and weakens the interactions between PA6 molecules. The difference in water content leads to differences in the initial state of the PA6 films. Higher water content PA6 films exhibit lower glass transition temperature, improved molecular chain mobility, lower elastic modulus and lower yield strength on the stress-strain curve. The presence of water enhances the molecular chain mobility of PA6 and slows down the rate of crystalline orientation along the stretching direction. At the same stretching ratio, the crystallinity and orientation degree of high water content samples are always lower than those of dry samples. At the same time, the stretching deformation process of PA6 is accompanied by γ→α phase transition: the interaction between molecules in samples with high water content is weak, and the molecular chain segments have better mobility. Its degree of phase transition that occurs during the stretching process is also higher. During the uniaxial stretching process, PA6 samples with different water contents exhibit the same trend: before the strain reaches 50%, the long period of the sample gradually increases, mainly due to the crystalline orientation along the stretching direction under tensile stress and the gradual extension of molecular chains in the amorphous region. At higher strain, the long period of all three samples decreased mainly due to the shear, slip, and fragmentation of the crystals under tensile stress, resulting in the formation of smaller crystal sizes. During the uniaxial stretching process, PA6 samples with high water content exhibit longer crystalline long period along and perpendicular to the stretching direction. This is due to their strong molecular chain segment mobility, resulting in a more relaxed structure that is more suitable for biaxial stretching.
Polyamide 6 (PA6) films with different water contents were prepared, the influence of water content on the microstructure evolution, including crystalline structure, orientation, polymorphic behavior, long period, of the PA6 films during stretching were investigated.
Keywords: polyamide 6, uniaxial stretching, plasticizer, structure evolution.
The authors declare that they have no known competing financial interests or personal relationships that could have appeared to influence the work reported in this paper.
It is well known that the comprehensive performance of nylon 6 (PA6) cast film will be significantly improved after biaxial stretching.1,2 However, the hydrogen bonding between PA6 molecular chains makes the biaxial stretching process extremely difficult.3,4 In the production process of biaxially stretched PA6 films, multiple methods are often needed to weaken the strong interactions between the molecular chains of PA6, in order to ensure the stable and high-speed subsequent stretching process.5-7 Different processing conditions have great impact on the condensed structure of materials.8,9 Therefore, investigation of the structural evolution of PA6 cast film during stretching is of great significance for the successful preparation of high-performance biaxially stretched PA6 films.10,11
Rozanski et al.12 modified the amorphous phase of PA6 with water, and studied the effect of water as a low molecular weight penetrating agent on the cavitation of PA6. Results revealed that introducing water as liquid penetrant can lead to the free volume to be filled, and the PA6 exhibits lower cavitation strength during tensile deformation compared to pure polymers. Shan et al.13 investigated the effects of temperature and strain rate on the tensile deformation of PA6, and found that the stress-strain curve of PA6 exhibited a double yield phenomenon. The occurrence of double yielding phenomenon is not only related to the thermal activation rates of temperature and strain rate, but also to the initial structure of the sample; Meanwhile, the yield mode of PA6 is determined by the synergistic effect of amorphous and crystalline deformation.
However, previous studies have mostly focused on the influence of crystalline structure and stretching conditions on the mechanical properties of PA6, without establishing a relationship between molecular structure and properties, nor paying attention to the influence of plasticizers such as water on the molecular structure of PA6, or the changing patterns and mechanisms of the above effects during the stretching process.14
In response to the above issues, this study prepared PA6 samples with different water contents, and used in situ infrared real-time monitoring of the diffusion process of water in the PA6 film. The influence of water on the functional groups, interactions and crystalline and amorphous structures of PA6 film were studied; subsequently, the films with different water contents were stretched to different strains, and the evolution in crystallinity, crystalline and amorphous structure, orientation behavior during stretching process was studied in detail. The influence mechanism of water content on the structural evolution of PA6 during tensile deformation was deeply explored.
Materials. The commercial PA6 cast film used in the experiment was purchased from Zhejiang Jintian Corp., China, with the thickness around 170 μm.
Sample Preparation. The PA6 cast film was dried in a vacuum oven at 75 ℃ for 72 h. After drying, the sample (named as dry sample, DS in short) was immediately placed into a sealed container containing absorbent silica gel to maintain a low water content in the sample as much as possible; After that, DS was treated under laboratory condition (temperature 23 ℃, relative humidity about 70%) for 72 h, and the obtained sample was named as moisture sample (MS in short); For the third sample (WS: wet sample), it was prepared by DS, which was directly immersed in distilled water at 23 ℃ for 72 h to obtain the material with the highest water content.15
Characterization. Thermogravimetric Analysis (TGA): For PA film samples with different moisture contents, the moisture content was tested using a thermogravimetric analyzer (TG 209 F1, NETZSCH Instruments GmbH, Germany). The experiment was conducted under a nitrogen atmosphere, with a testing temperature ranging from 30 to 300 ℃ and a heating rate of 20 ℃/min.
Fourier Transform Infrared Spectroscopy (FTIR): The chemical structure of the PA6 samples was tested using FTIR (Frontier FTIR Spectrometer, PerkinElmer Co., Ltd., USA), with a scanning range of 4000 cm-1 to 650 cm-1, a resolution of 4 cm-1, and 16 scans.16,17
The diffusion process of water molecules in the PA6 membrane during the water absorption process was monitored through time-dependent ATR-FTIR. The sample was cut into a size of 2 cm × 2 cm and placed on a ZnSe optical window. 2 cm × 2 cm hydrophilic polytetrafluoroethylene (PTFE) filter paper was placed on the sample, and deionized water is dropped into the PTFE filter paper to simulate the water absorption process of PA6 samples. During this process, a time-dependent ATR-FTIR device was used to collect spectra every minute until the spectra no longer changed. Due to the instrument's incident light intake, the sample thickness was less than 1 μm, which is much lower than the membrane thickness, and the diffusion rate of water on the filter paper is much higher than its diffusion rate in the direction of sample thickness, so it is considered that the diffusion of water on the sample thickness is uniform.18,19
Differential Scanning Calorimetry (DSC): Thermal analysis was performed using DSC (DSC 3+, Mettler Toledo, Switzerland). The temperature and heat flux of the instrument were calibrated using indium as the standard sample. 3-5 mg of the sample was weighed using an electronic balance, and the sample was heated from 25 to 250 ℃ at a rate of 10 ℃/min in a nitrogen atmosphere (50 mL/min). The crystallinity of PA6 can be calculated based on the following formula:20-22

where ∆Hm is the melting enthalpy of PA6, and ∆Hmo= 190 J/g is the melting enthalpy of PA6 when fully crystallized.23
X-ray Diffraction Testing (XRD): X-ray diffraction (Ultima, Rigaku, Japan) was used to characterize the crystal structure of the sample. The X-ray source was a copper target, with a tube voltage of 20-60 KV and a tube current of 20-60 mA. The goniometer had a radius of 185 mm, a scanning range of 5-50°, and a scanning rate of 5°/min.24-26
Two Dimensional Small Angle X-ray Diffraction (2D-SAXS): The structure of PA6 samples was characterized by 2D-SAXS (Xenocs 2.0, France). Instrument uses copper targets (λ = Using 0.154 nm) as the radiation source, the two-dimensional detector PILATUS3 300K has a resolution of 680 pixels x 600 pixels and a pixel size of 172 μm. During sample testing, the distance between the sample and the detector is 370 mm, and the effective range of scattering vector q (q = 4π sin θ/λ) is 0.27-11.4 nm-1. The exposure time of the sample is 5 min.27-29
Integrate the obtained scattering spectrum in a circular pattern to obtain 1D-SAXS data, which is the variation of scattering intensity I(q) with scattering vector q. For unoriented and oriented samples, considering the shape factor of the layered crystal structure, the scattering intensity is multiplied by q2 and Lorentz corrected to plot q,30,31 and then the long period of the crystalline in the sample are calculated using the Bragg equation as follows:32,33

where qmax is the q value corresponding to the maximum scattering intensity. When the sample is not stretched, the one-dimensional electron density correlation function method is used and calculated as:

where Icor is the Lorentz correction strength, Q is the constant defined as:

Dynamic Mechanical Performance Testing (DMA): The PA6 samples were cut into required size for DMA measurement (DMA850, TA, USA). The testing mode was stretching mode under an air atmosphere, the testing temperature range was -20 to 120 ℃, the testing frequency was 1 Hz, and the heating rate was 3 ℃/min.34,35
Mechanical Performance Testing: The three groups of samples were cut into rectangular splines with a size of 10 cm × 1 cm for tensile test using a universal material testing machine (CMT6104, MTS SYSTEM (CHINA) Corp., Ltd., USA) at a speed of 20 mm/min to different strains. For further measurement, the dimensions of the stretched samples were fixed for 30 minutes to suppress elastic recovery. The stretched samples were named as DS-e, MS-e or WS-e, where e represents tensile strain, for example, WS-1 represents the WS sample stretching to a strain of 100%.36-38
Polarized Infrared Spectroscopy Testing: The molecular chain orientation of the stretched PA6 sample was tested using Frontier FTIR Spectrometer (PerkinElmer Co., Ltd., USA). Tested in ATR mode at room temperature (25 ℃) using ZnSe material polarizers located between the light source and the sample, with a testing range of 4000 - 650 cm-1, a resolution of 4 cm-1, and 8 testing cycles. When testing, the sample plane is placed perpendicular to the light. Each sample is first tested parallel to the direction of polarization vibration in the stretching direction to obtain a parallel spectrum. Then, the sample is rotated 90° to test the vertical spectrum of the stretching direction perpendicular to the direction of polarization vibration, and the infrared dichroism ratio (D) of the stretched sample is calculated based on this.39-41
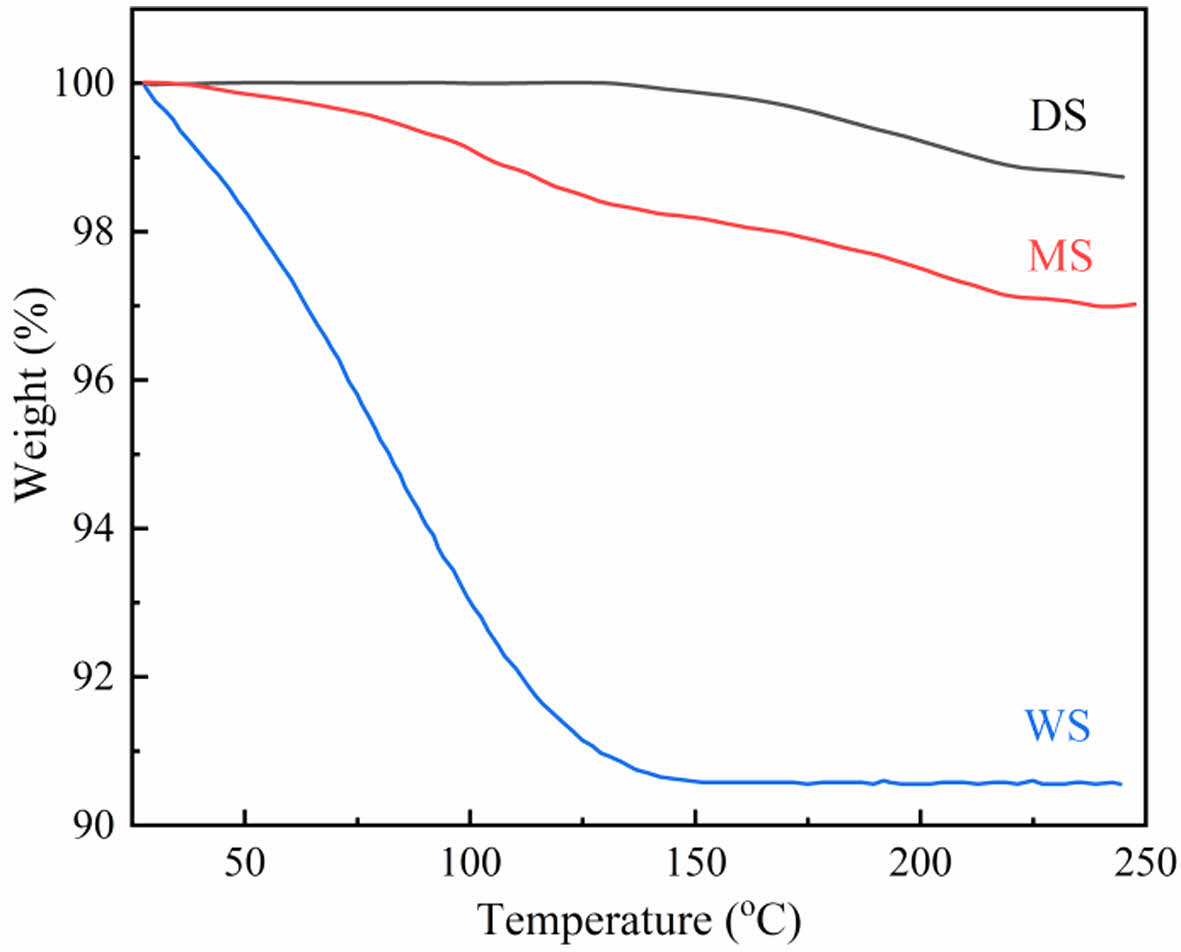
Structure Characterization of the Unstretched Films. Water Content of the Films Measured by TGA: Figure 1 shows the TGA curves of three PA6 samples with different water contents. It can be seen that the humidity of DS is the lowest (1.2%); The moisture content of MS is more than two times that of DS (3.0%); WS has the highest water content, with a water content of about 9.4%.
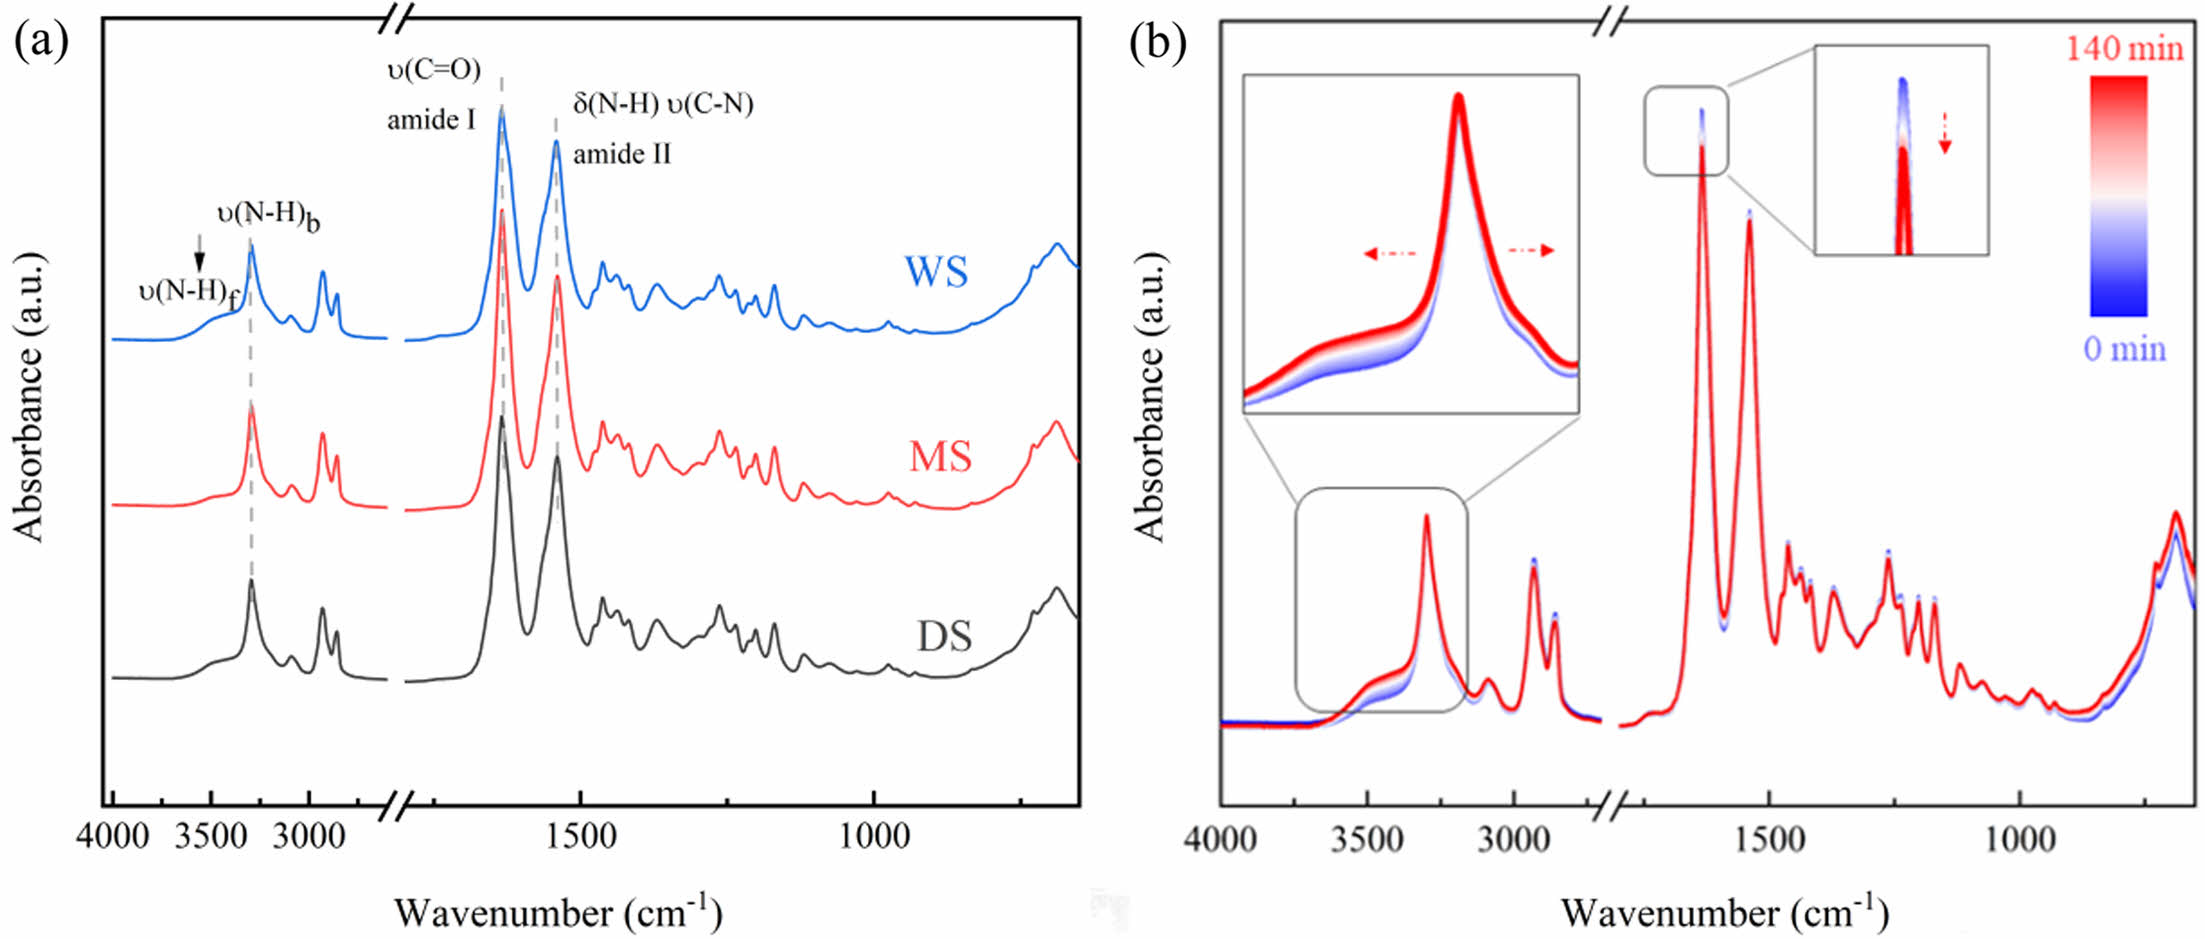
FTIR Analysis: The FTIR spectra of the PA6 samples with different water contents are shown in Figure 2(a). The hydrogen bonding between PA6 molecular chains has a significant impact on the aggregation state and mechanical behavior of PA6, so most infrared spectroscopy research focuses on the amide groups of PA6. The strong absorption peak at 1645 cm-1 belongs to the amide-I band, mainly due to the stretching vibration of C=O; Another strong absorption peak of 1544 cm-1 corresponds to the amide-II band, mainly provided by the bending vibration of N-H and the stretching vibration of C-N.42 In addition, 3100-3500 cm-1 is the stretching vibration peak of N-H, which is also a strong absorption peak in the PA6 infrared spectrum. This region is more sensitive to hydrogen bonds, mainly including the free N-H vibration at 3444 cm-1, the N-H vibration of hydrogen bonds in the crystalline and ordered amorphous regions at 3300 cm-1, and the NH vibration in the amorphous region at 3310 cm-1. The intensity of v(NH)b is much greater than ν(NH)f, indicating that the most NH in the PA6 membrane forms hydrogen bonds.
Due to the high thickness of the PA film, the energy of ATR FTIR instrument is weak, and it is not sensitive enough to capture the spectral changes of the sample after water absorption. However, the position and width of the amide group absorption peak has great response to the weak changes in hydrogen bonding, and in situ infrared can observe the complete process of the absorption peak with the change of the group online. Through in situ infrared spectroscopy, real-time data on the interaction between water and PA6 molecules can be read, greatly shielding external influencing factors and ensuring the accuracy of the data. In this section, time-dependent in situ ATR-FTIR was utilized to record the diffusion process of water molecules in DS, and the results are shown in Figure 2(b).
The changes in absorption peaks at 3299 cm-1 and 3478 cm-1 are attributed to the increase in distance between PA6 molecular chains as water enters the sample, leading to the breakdown of strong hydrogen bonding interactions within the chains and the emergence of more free NH vibrations.43 Meanwhile, the intensity of these absorption peaks attributed to free hydrogen bonding NH vibrations increases, the absorption peaks widen, the absorption peak intensities increase, which also shift towards lower wavenumbers. However, it is observed that water can hardly affect the crystalline region of PA6 molecules, so it has little effect on the NH vibration in the crystalline region, and the absorption peak intensity at 3299 cm-1 remains almost unchanged.
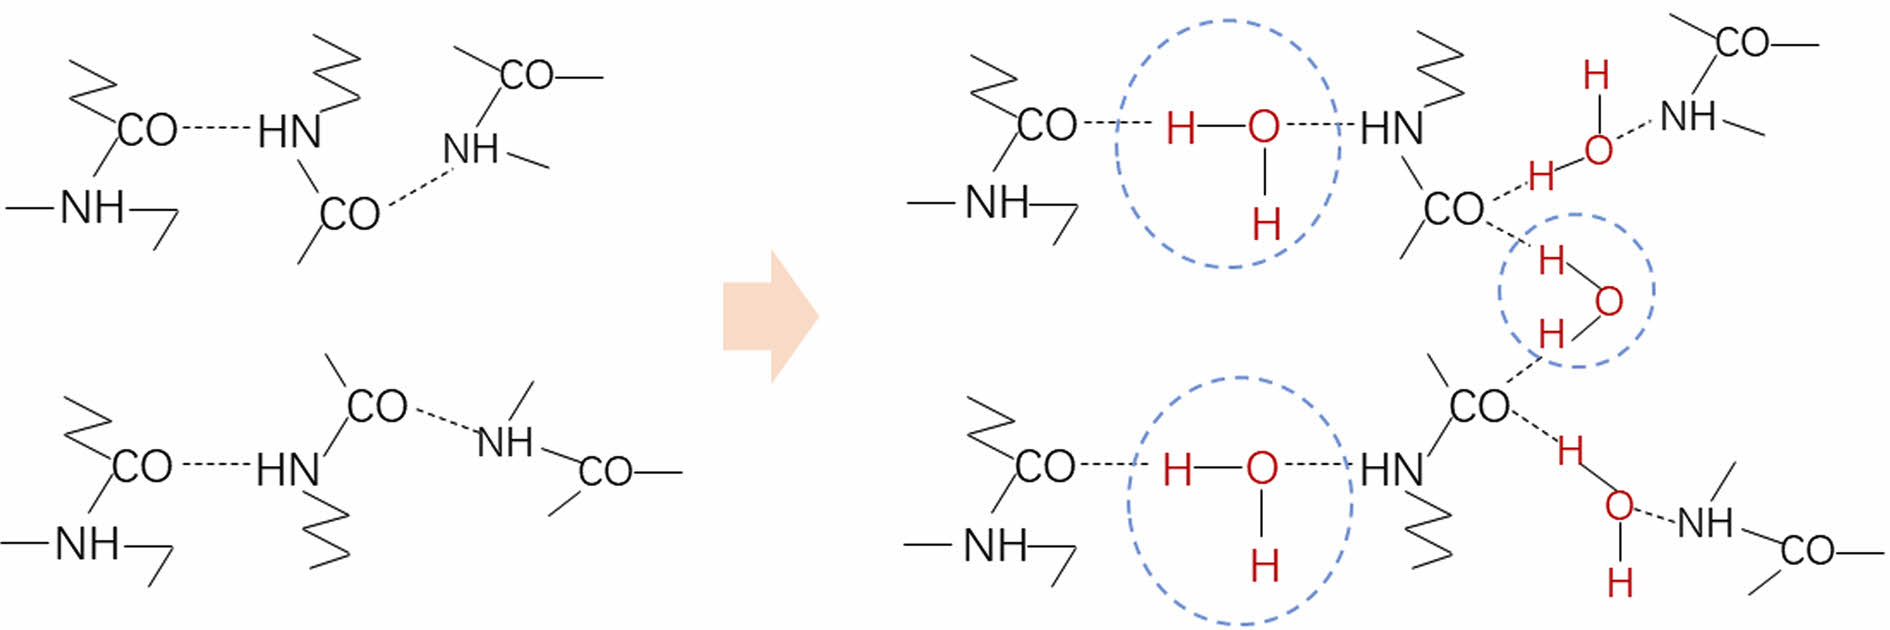
As the diffusion time increases, water partially hydrates free C=O groups, forming C=O::H2O complex, resulting in a decrease in the overall number of free C=O groups. At the same time, hydration disrupts the hydrogen bonding between the original C=O group and the NH group (Figure 3). The hydrogen bonding formed by the combination of water molecules and acylamide groups is significantly weaker than the hydrogen bonding formed between amide groups, resulting in a weakened absorption peak intensity of amide-I and amide-II bands.
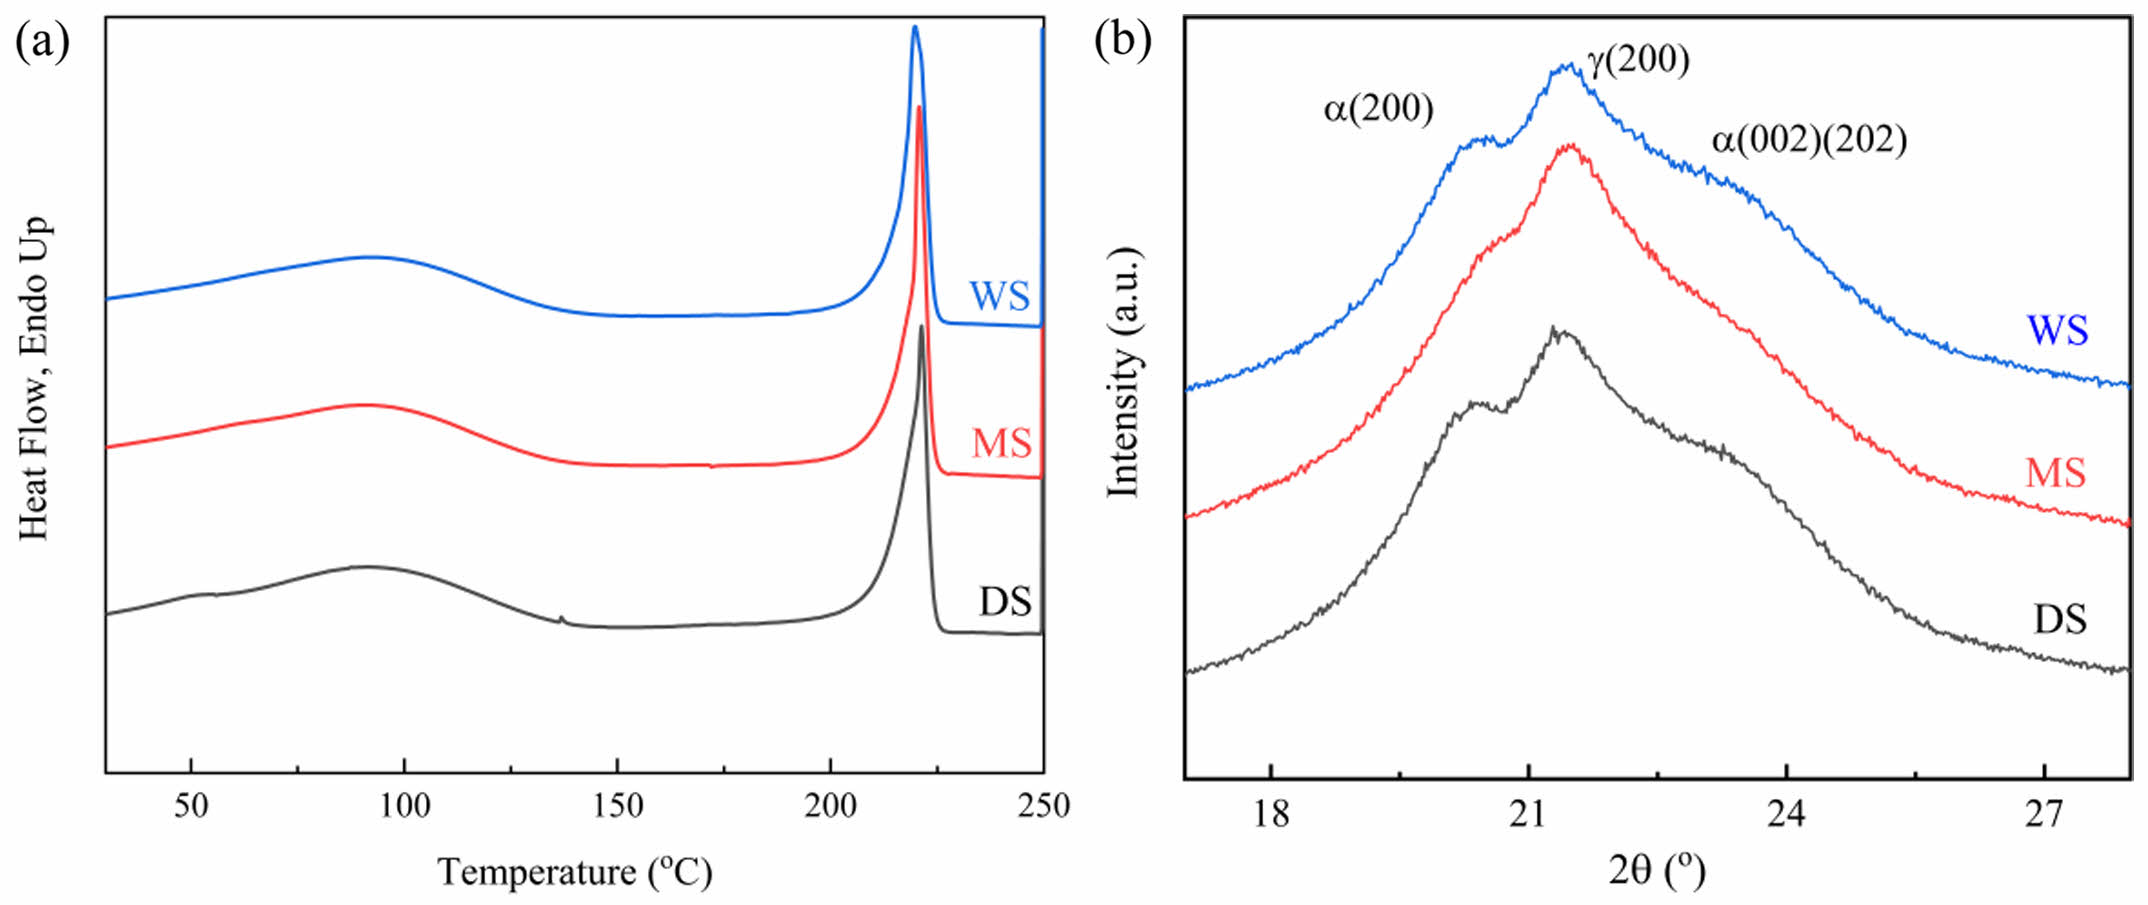
WAXD and DSC Study: The DSC melting curves and XRD spectra of PA6 samples are shown in Figure 4. It can be observed that the DSC melting curves of three PA6 samples are quite similar. This is due to the fact that water only affects amorphous polymer chains, and the mobility of polymer chains in amorphous phases is limited by the presence of crystalline domains. In Figure 4(b), PA6 films show different peaks at diffraction angle 2θ of approximately 20.3°, 21.5°, and 23.3°, indicating that all three PA6 cast films contain both a- and g-phase crystalline.44 WS with high water content shows significantly reduced intensity of the diffraction peak (200), which can be attributed to the fact that, the water absorption process of PA6 film breaks the molecular hydrogen bonds between PA6 segments, reduces the intermolecular interactions, and increases the interplanar spacing.
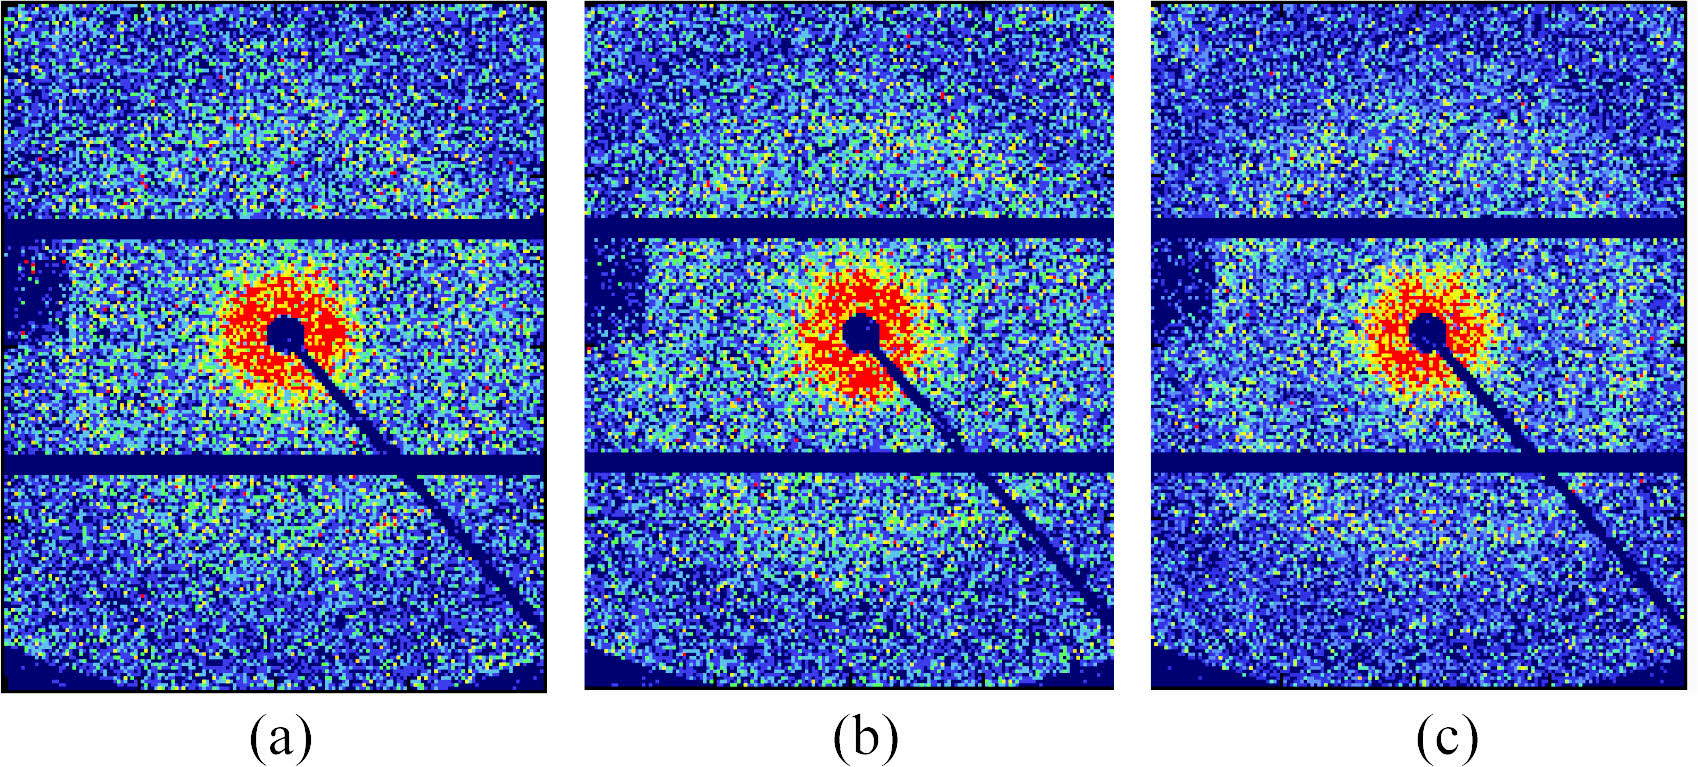
2D-SAXS Investigation: The 2D-SAXS spectra of PA6 samples with different water contents are shown in Figure 5. The crystalline characteristic scattering signals of the three samples exhibit isotropic rings with uniform intensity distribution, indicating that there is no orientation structure inside the samples when they are not stretched.45 In order to detect changes in crystalline structure and further analyze the effect of water content on the crystalline structure of PA6 film, the average long period (Lp) and amorphous thickness (La) obtained from one-dimensional correlation functions were calculated. The thickness of the crystal (Lc) can be obtained by subtracting the amorphous thickness (La) from the long period (Lp). Due to the crystallinity of PA6 in the measured sample being less than 50%, the smaller value between Lp and La and the subtracted result is the thickness of the crystalline layer, as shown in Table 1.
In Table 1, as the water content of the PA6 sample increases, both Lp and La show a significant increase, indicating that the entry of water molecules disrupts the intermolecular forces of PA6, and the molecular chain segments in the disordered region relax and expand strongly, resulting in an increase in interlayer distance; Compared to the thickness of the long period and amorphous region, the change in crystal thickness is weak. This is because water molecules almost cannot damage the crystalline structure, which is consistent with the XRD and DSC results.
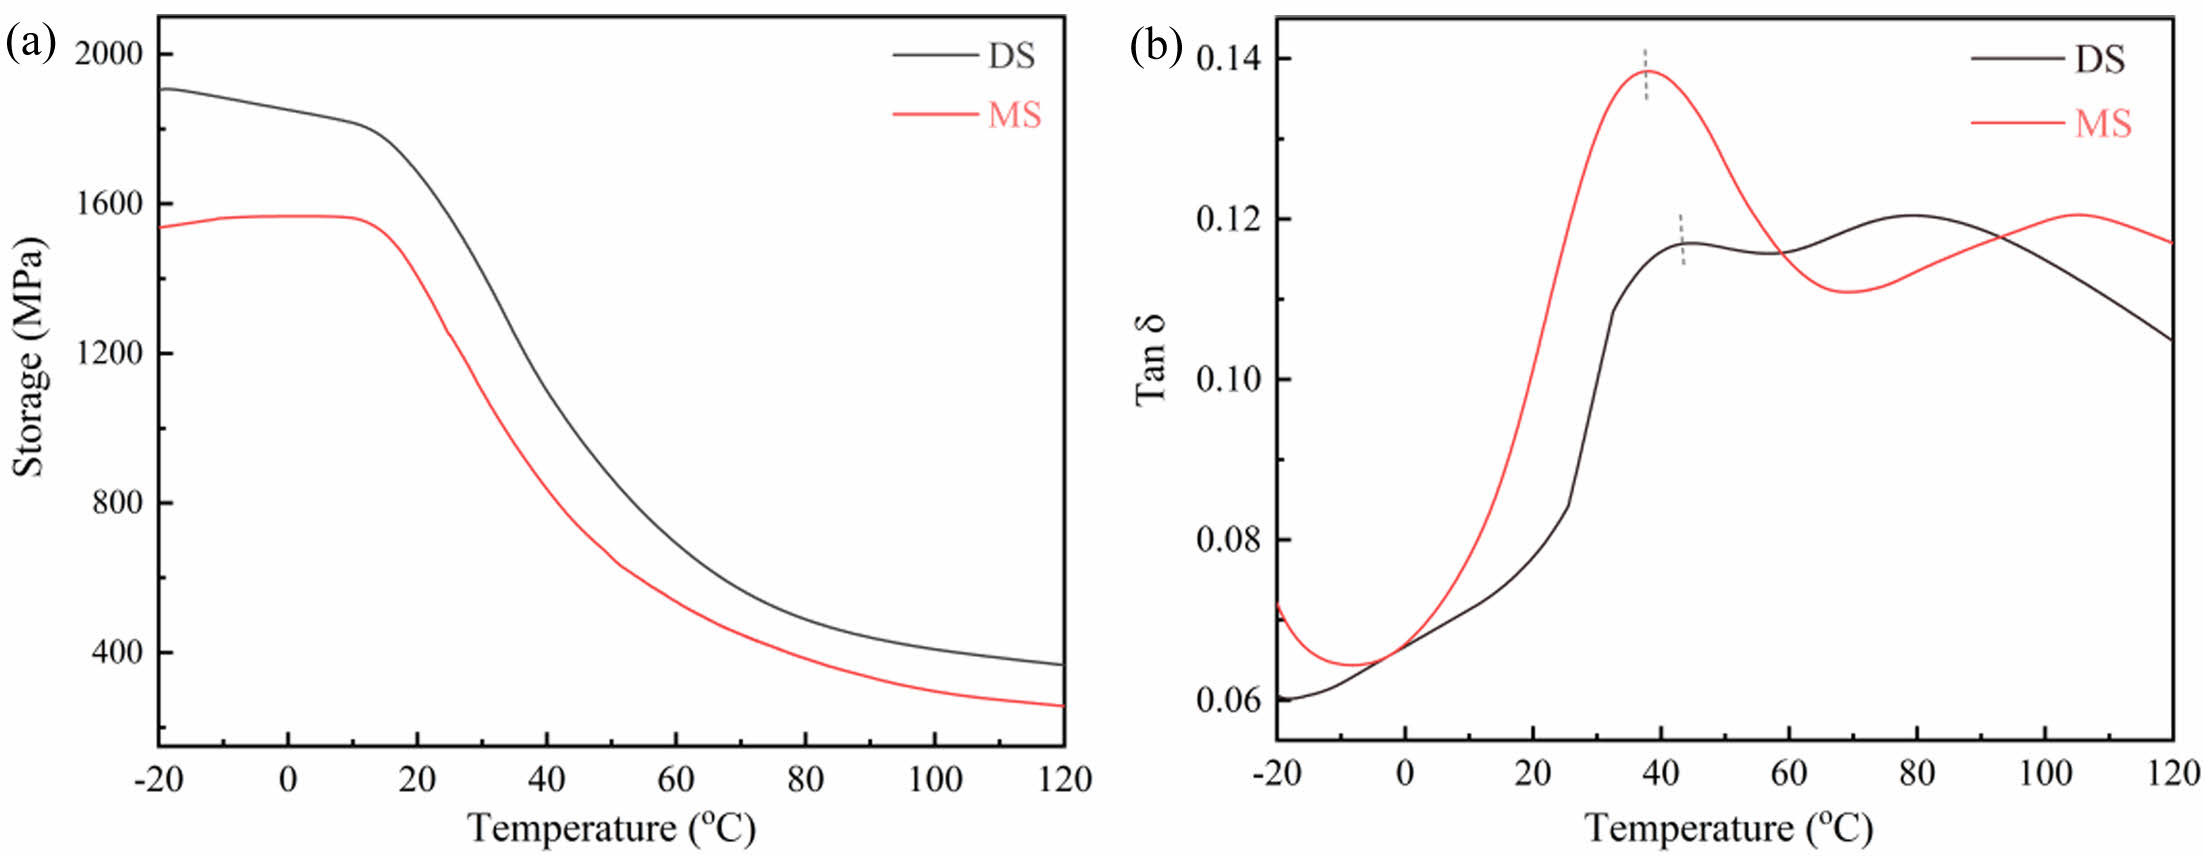
DMA Measurement: DMA is an effective method for studying molecular movement, which can characterize the movement of molecular chain segments in the PA films.46 Figure 6 shows the storage modulus (E') and loss factor (tanδ) of the samples. The storage modulus of DS is larger than that of MS, indicating that the interaction between PA6 molecular chains in DS is stronger, and its mobility of molecular chain segments is weaker. Meanwhile, the temperature corresponding to the loss factor peak is the glass transition temperature (Tg) of the sample. compared with the Tg of DS (44.6 ℃), the Tg of MS (37.6 ℃) is significantly reduced, indicating that the presence of water enhances the activity of PA6 macromolecular chains, weakens the interactions between molecular chains.
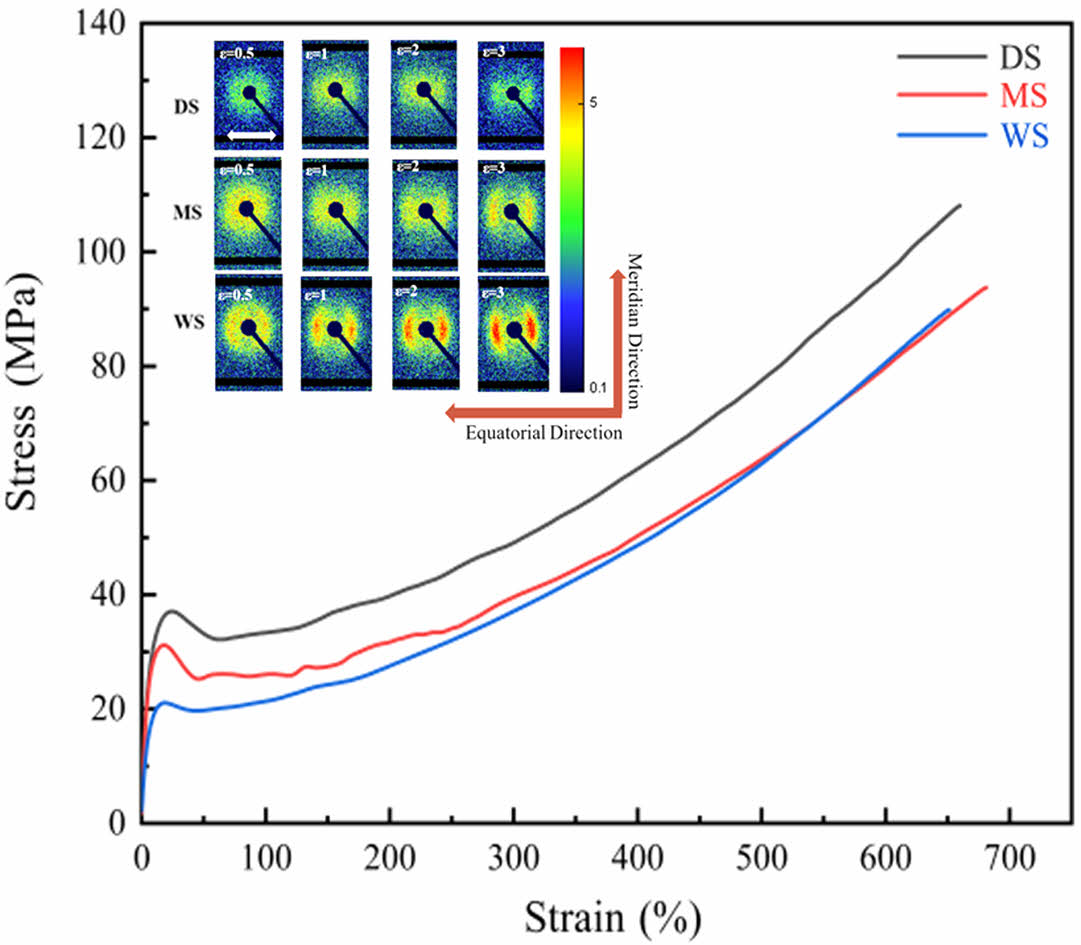
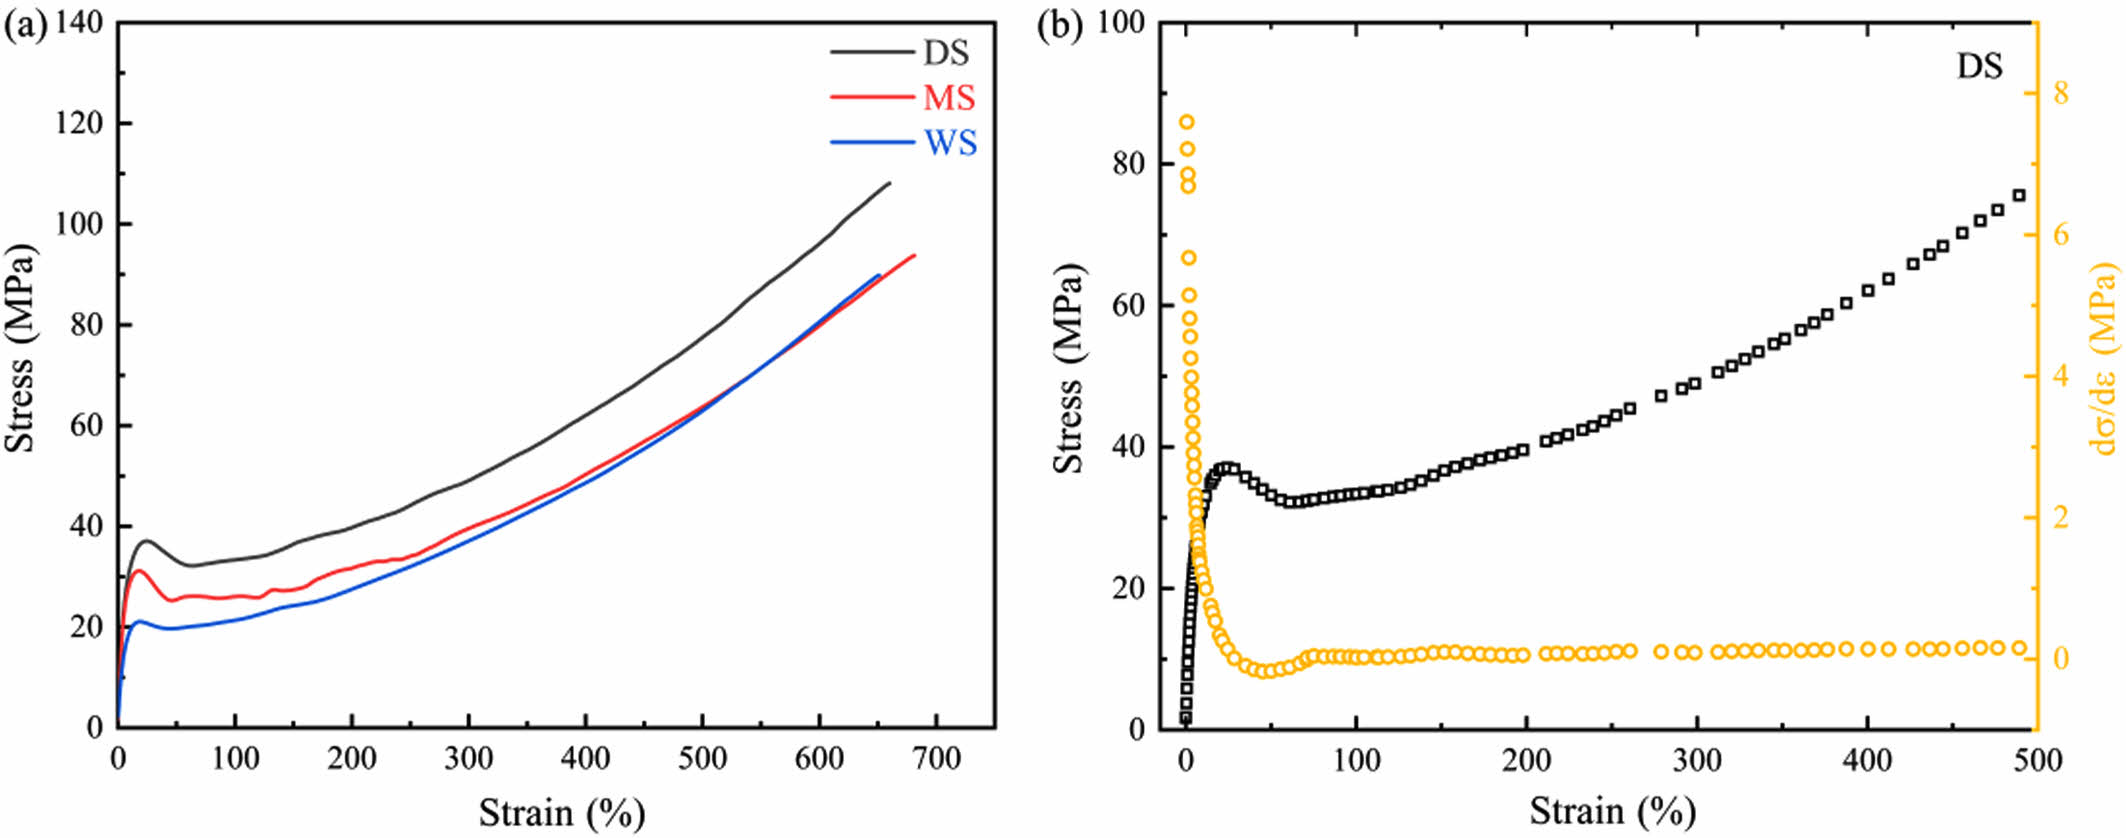
Morphology Evolution of Different PA6 Films During Stretching. Tensile Measurement: Figure 7 shows the stress-strain curves of PA6 films with different water contents, as well as the derivative curve of DS. The obtained elastic modulus, yield strength and tensile strength are listed in Table 2.
With the increase of stretching ratio, the stretching process of three samples is accompanied by varying degrees of yield process. Moreover, Figure 7(b) reveals that in the initial stage of stretching, when the strain is small, the derivative curve of DS has a relatively large value, indicating that in the initial stretching stage of DS, the stress changes rapidly with the increase of strain, and the DS sample exhibits high rigidity. As the strain increases, the value of the derivative curve significantly decreases, indicating a decrease in the slope of the stress-strain curve, which means that the DS sample has undergone yielding behavior and entered the plastic deformation stage, moreover, the rate of stress increase slows down, and the ability to resist deformation weakens. As the strain further increases, the numerical variation of the derivative curve is relatively small, reflecting that stress changes at a relatively constant rate with the increase of strain.
Comparing the samples with different water content, it can be seen that the yield process of DS is the most obvious. For WS with the highest water content, its yield behavior and necking are the mildest. The shape of the entire WS sample changes uniformly. On the other hand, DS has the highest yield strength, reaching 31.9 MPa, while as the water content increases, the yield strength of WS is only 19.6 MPa, indicating a strong correlation between yield strength and the water content in PA6.
The above results indicate that the presence of water reduces the intermolecular forces of PA6 films and are more prone to uniform deformation during stretching, making them more suitable for biaxial stretching.
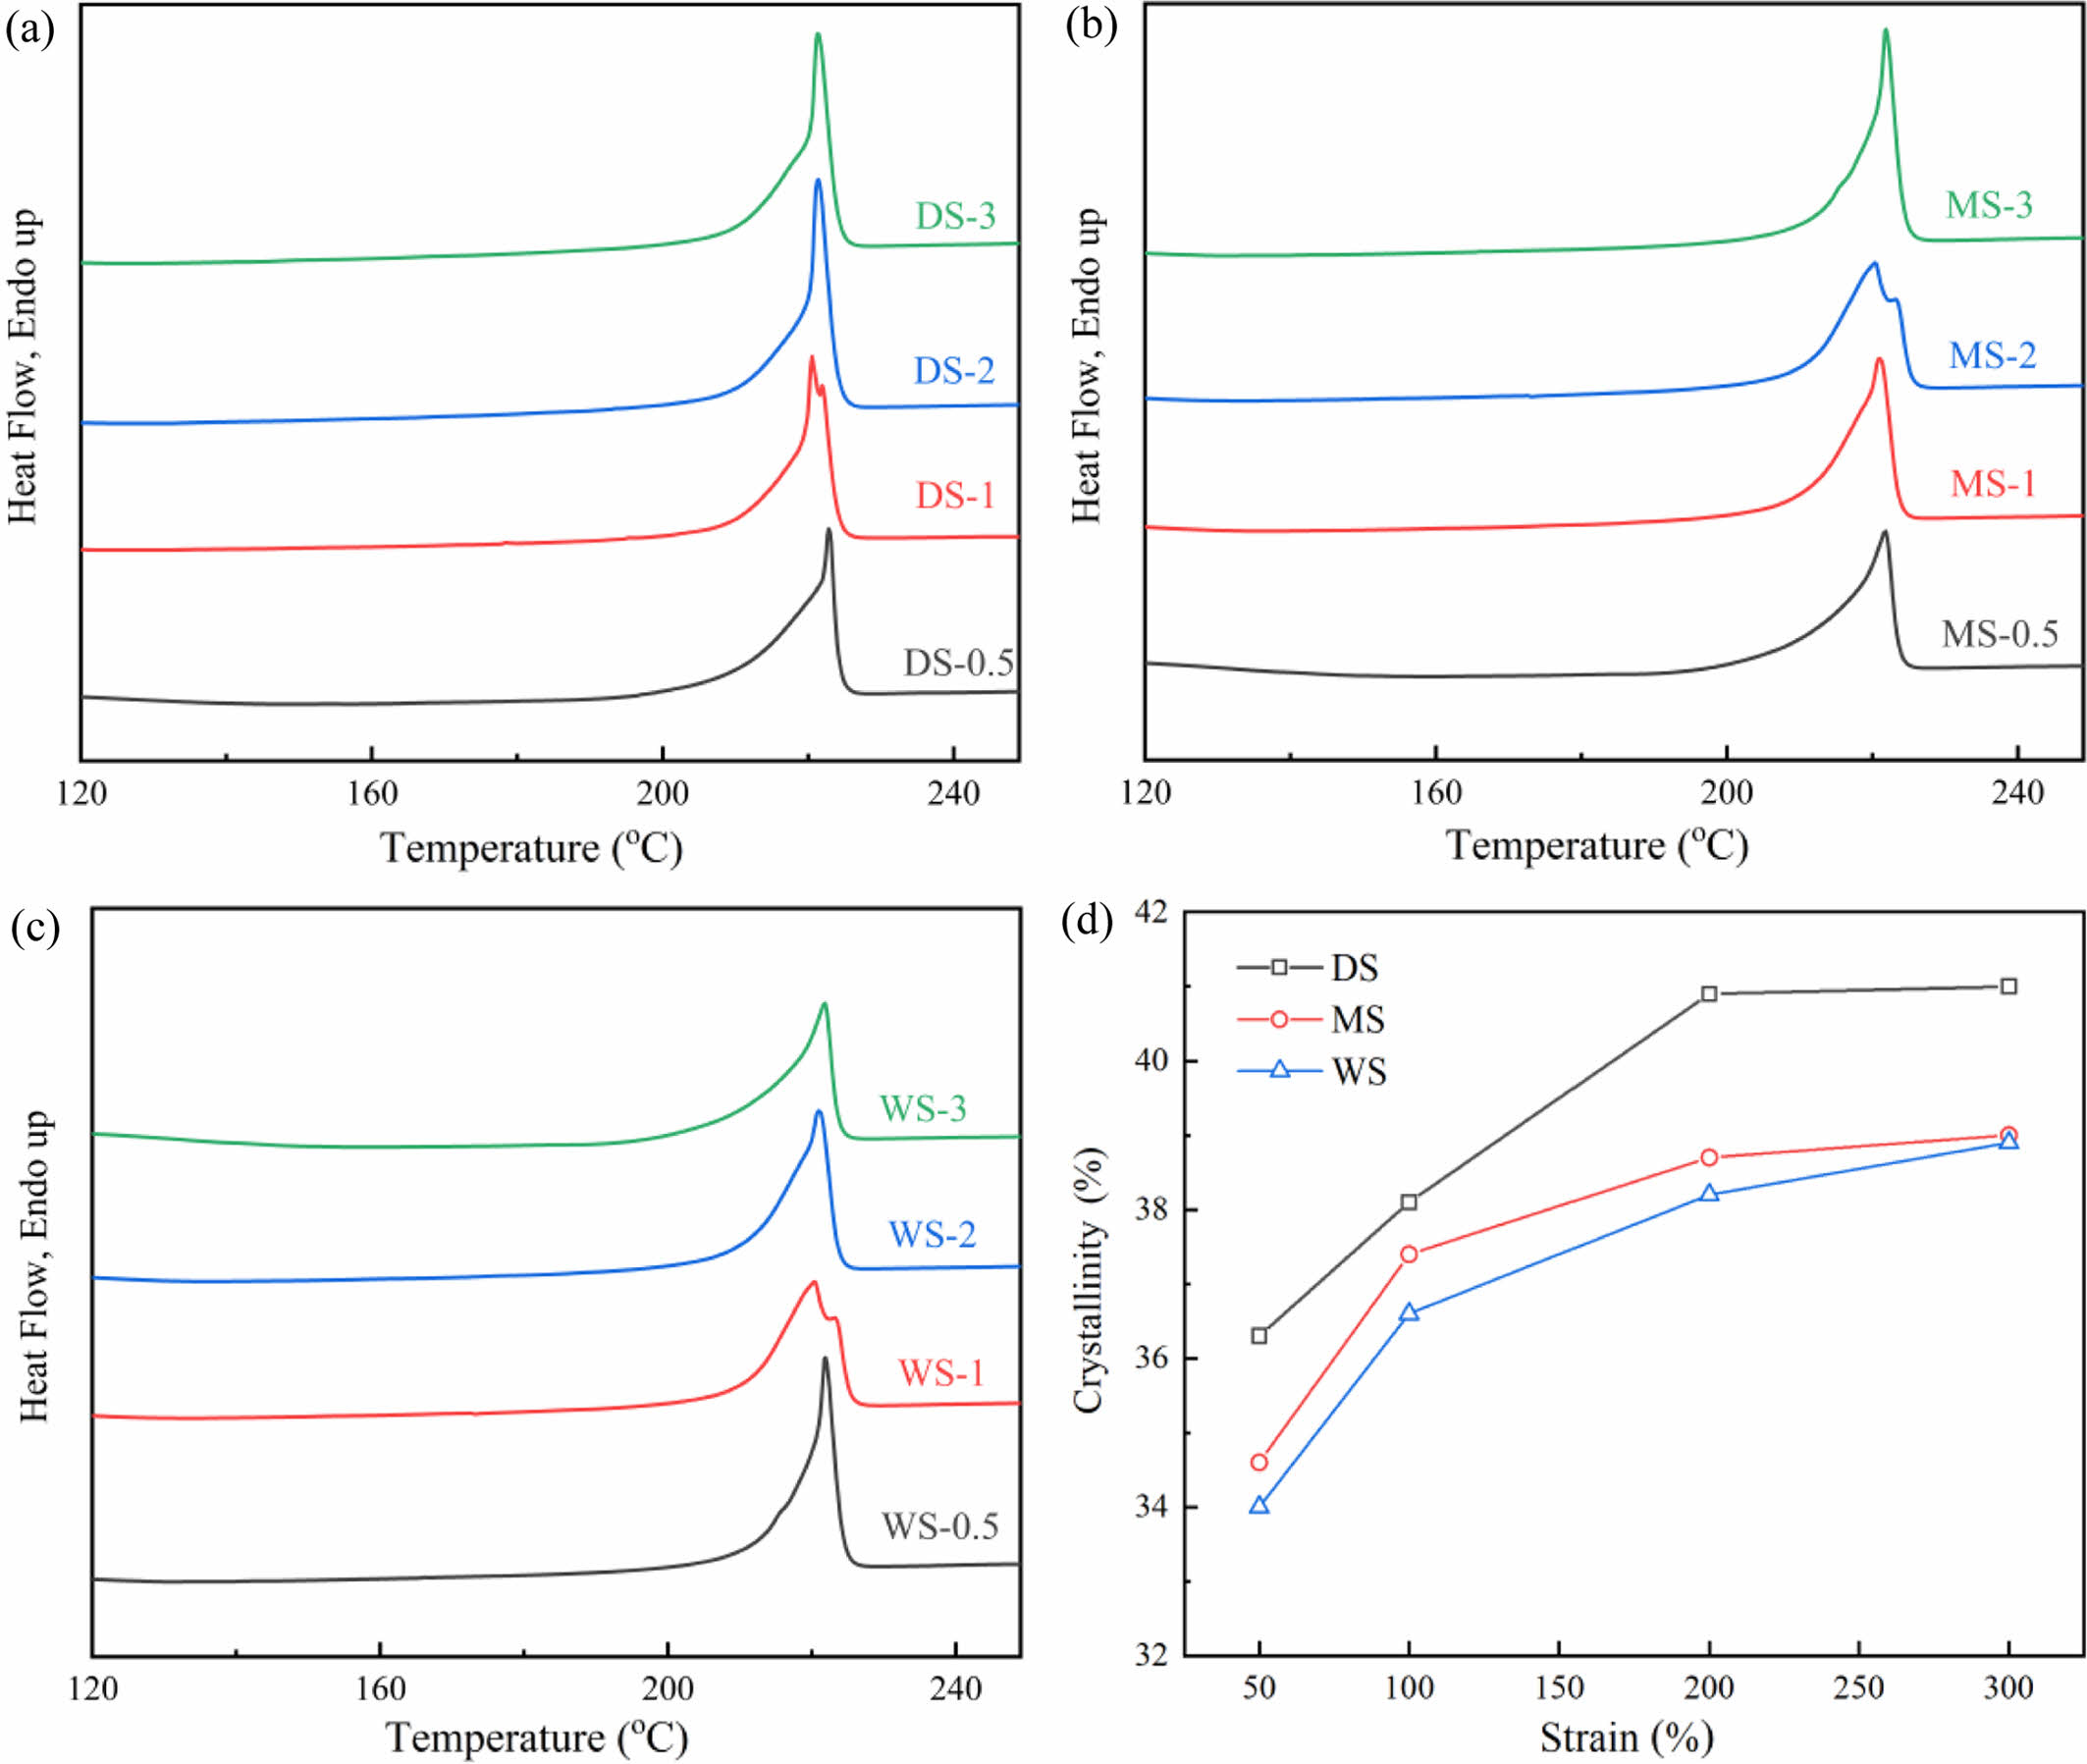
DSC Measurement: Figures 8(a)-(c) show DSC melting curves of different PA film stretched to different draw ratio. It can be seen that although all three samples contain both α- and γ-phase, their DSC melting curves mainly show α-phase melting peak (around 220 ℃). In addition, samples at low draw ratio (DS-0.5, MS-0.5, WS-0.5) have wider melting peaks, indicating a wider distribution of lamellar thickness. As the draw ratio increases, the melting peaks of all three samples become narrower and slightly shift towards lower temperatures.
Figure 8(d) shows the changes in crystallinity of the samples as a function of stretching ratio. It can be observed that as the stretching ratio increases, the crystallinity of all three samples increases gradually. Moreover, during the stretching process from e = 50% to e = 100%, the increases in crystallinity of WS and MS are larger compared to DS. This is because the presence of water increased the molecular chain activity of PA6 samples. At the same stretching ratio, samples with higher water content had higher molecular migration rates, higher proportion of slip rearrangement and recrystallization, and the crystallinity of the samples can be arranged from high to low as: DS>WS>MS. As the stretching ratio further increases, the increases of crystallinity of WS and MS tend to flatten, while DS exhibits higher crystallinity and higher tensile strength. In the subsequent stretching process, it can be foreseen that DS is more difficult to be uniformly stretched and deformed.
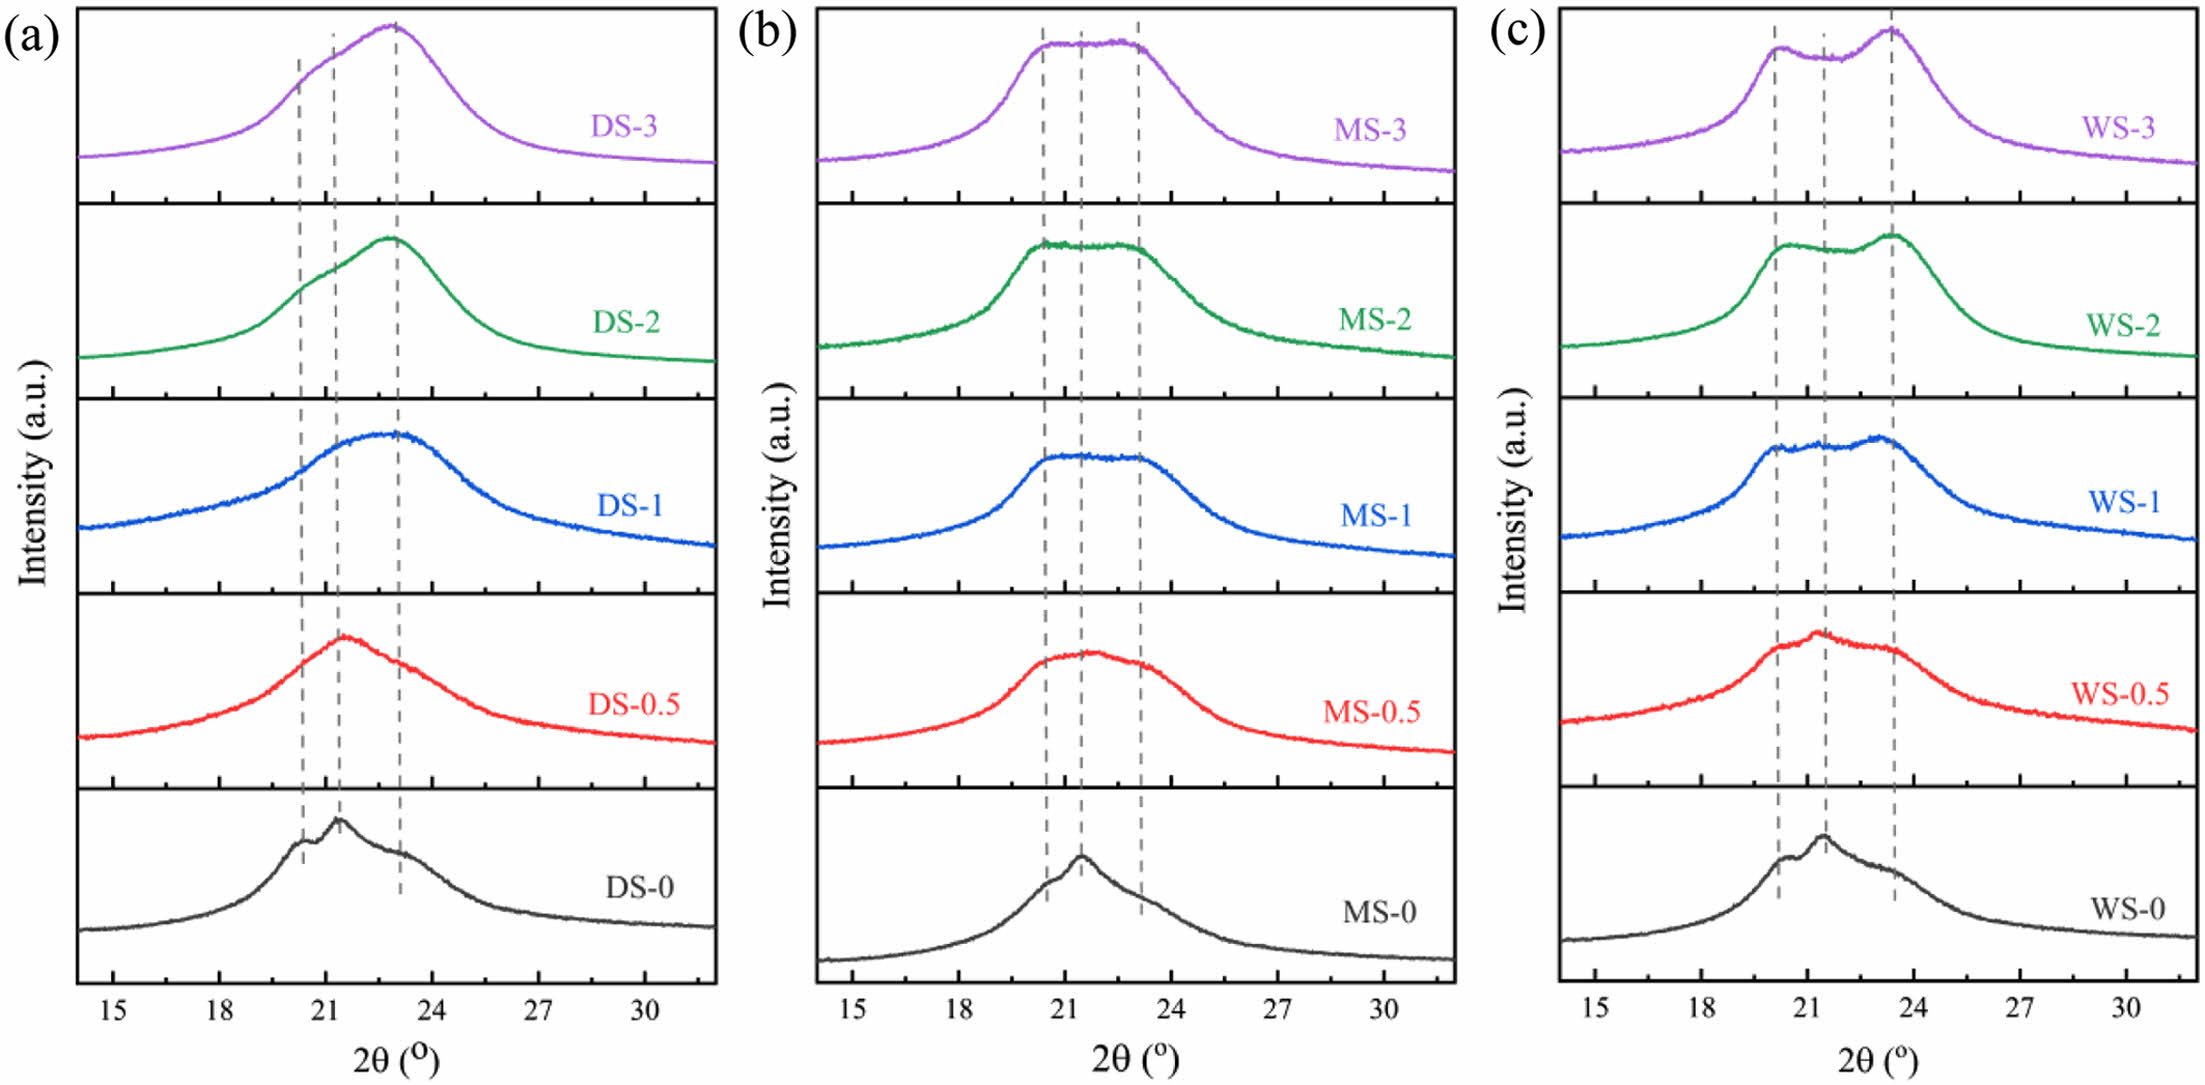
WAXD Investigation: Figure 9 shows the XRD spectra of three samples stretched to different magnifications. The unstretched PA6 films exhibited both α- and γ-phase, however, after stretching, they mainly show the pattern of monoclinic α-phase. As the stretching ratio increases, the intensities of some peaks increase, indicating that water content has an impact on the tensile properties of the PA6 films, such as orientation and crystallinity. In addition, the stretching process is accompanied by γ→α phase transition, and different water contents result in different degree of γ→α phase transition.
Comparing the samples with different water content, it can be seen that for DS, as the stretching ratio increases, the intensity of γ(200) decreases gradually, meanwhile, the intensities of α(200) and α(002/202) increase, which gradually merge into a large peak; For MS and WS, the situation is slightly different: as the stretching ratio increases, the diffraction peak of γ(200) gradually decreases and disappears. When stretching ratio reaches 200%, we can only observe the characteristic peaks of α(200) and α(002/202), indicating that as the stretching ratio increases, the PA6 crystalline molecular chains oriented along the stretching direction increase.
From a view of mechanistic analysis, for the phase transition caused by stretching, the following two conditions must be met: first, γ phase should be sufficiently stretched to twist the chains around the amide bonds. Second, sufficient molecular mobility should be achieved to alter their stacking. In PA6 macromolecular chains, strong hydrogen bonding forces are formed between adjacent molecular chains in the crystalline and amorphous regions, which limits the migration of molecules and further limits the damage of γ-phase during stretching. Sample with higher water content (WS>MS>DS) weakens the hydrogen bonding force between PA6 molecular chains to a larger extent, leading to larger increase in PA6 molecular mobility, and finally causes a more deeply γ→α phase transition.
Moreover, the transformation from γ- to α-phase will affect the dimensional stability of PA6 film. The formation of the α-phase makes the structure of the PA6 film more stable, and the dimensional change after stretching is supposed to be relatively small, which is beneficial for improving the dimensional stability of the material during stretching. But if the transformation from γ- to α-phase is incomplete or uneven (the DS sample), stress concentration may occur inside the material, leading to a decrease in dimensional stability.
Evolution of Orientation Behavior During Stretching Process: The orientation behavior of PA6 samples was tested using polarized infrared spectroscopy. Polarized infrared spectroscopy can observe the absorbance changes of spectral bands under different polarized light, study the properties and attribution of absorption bands, and provide information about the condensed state of molecules taken backwards, such as single crystal structure, molecular chain conformation, orientation, and other condensed state structures.47 For PA6 film, the main characteristic bands for α-phase include 1201, 1030, 960, 928, 830, 692, 440, and 294 cm-1; the main characteristic bands for γ-phase exist at 1235, 1170, 975, 712, and 317 cm-1. For the uniaxial stretching process of PA6 film, the infrared dichroism ratio (D)48-50:

Among them, A|| is the absorbance measured when the vibration direction of polarized light is parallel to the reference direction, and A^ is the absorbance measured when the vibration direction of polarized light is perpendicular to the reference direction. The D value of the PA6 film depends on two characteristic angles, θ and β, where θ is the angle between the polymer chain axis and the stretching direction, and β is the angle between the chain axis and the transition moment. The orientation of molecular chains is51,52:

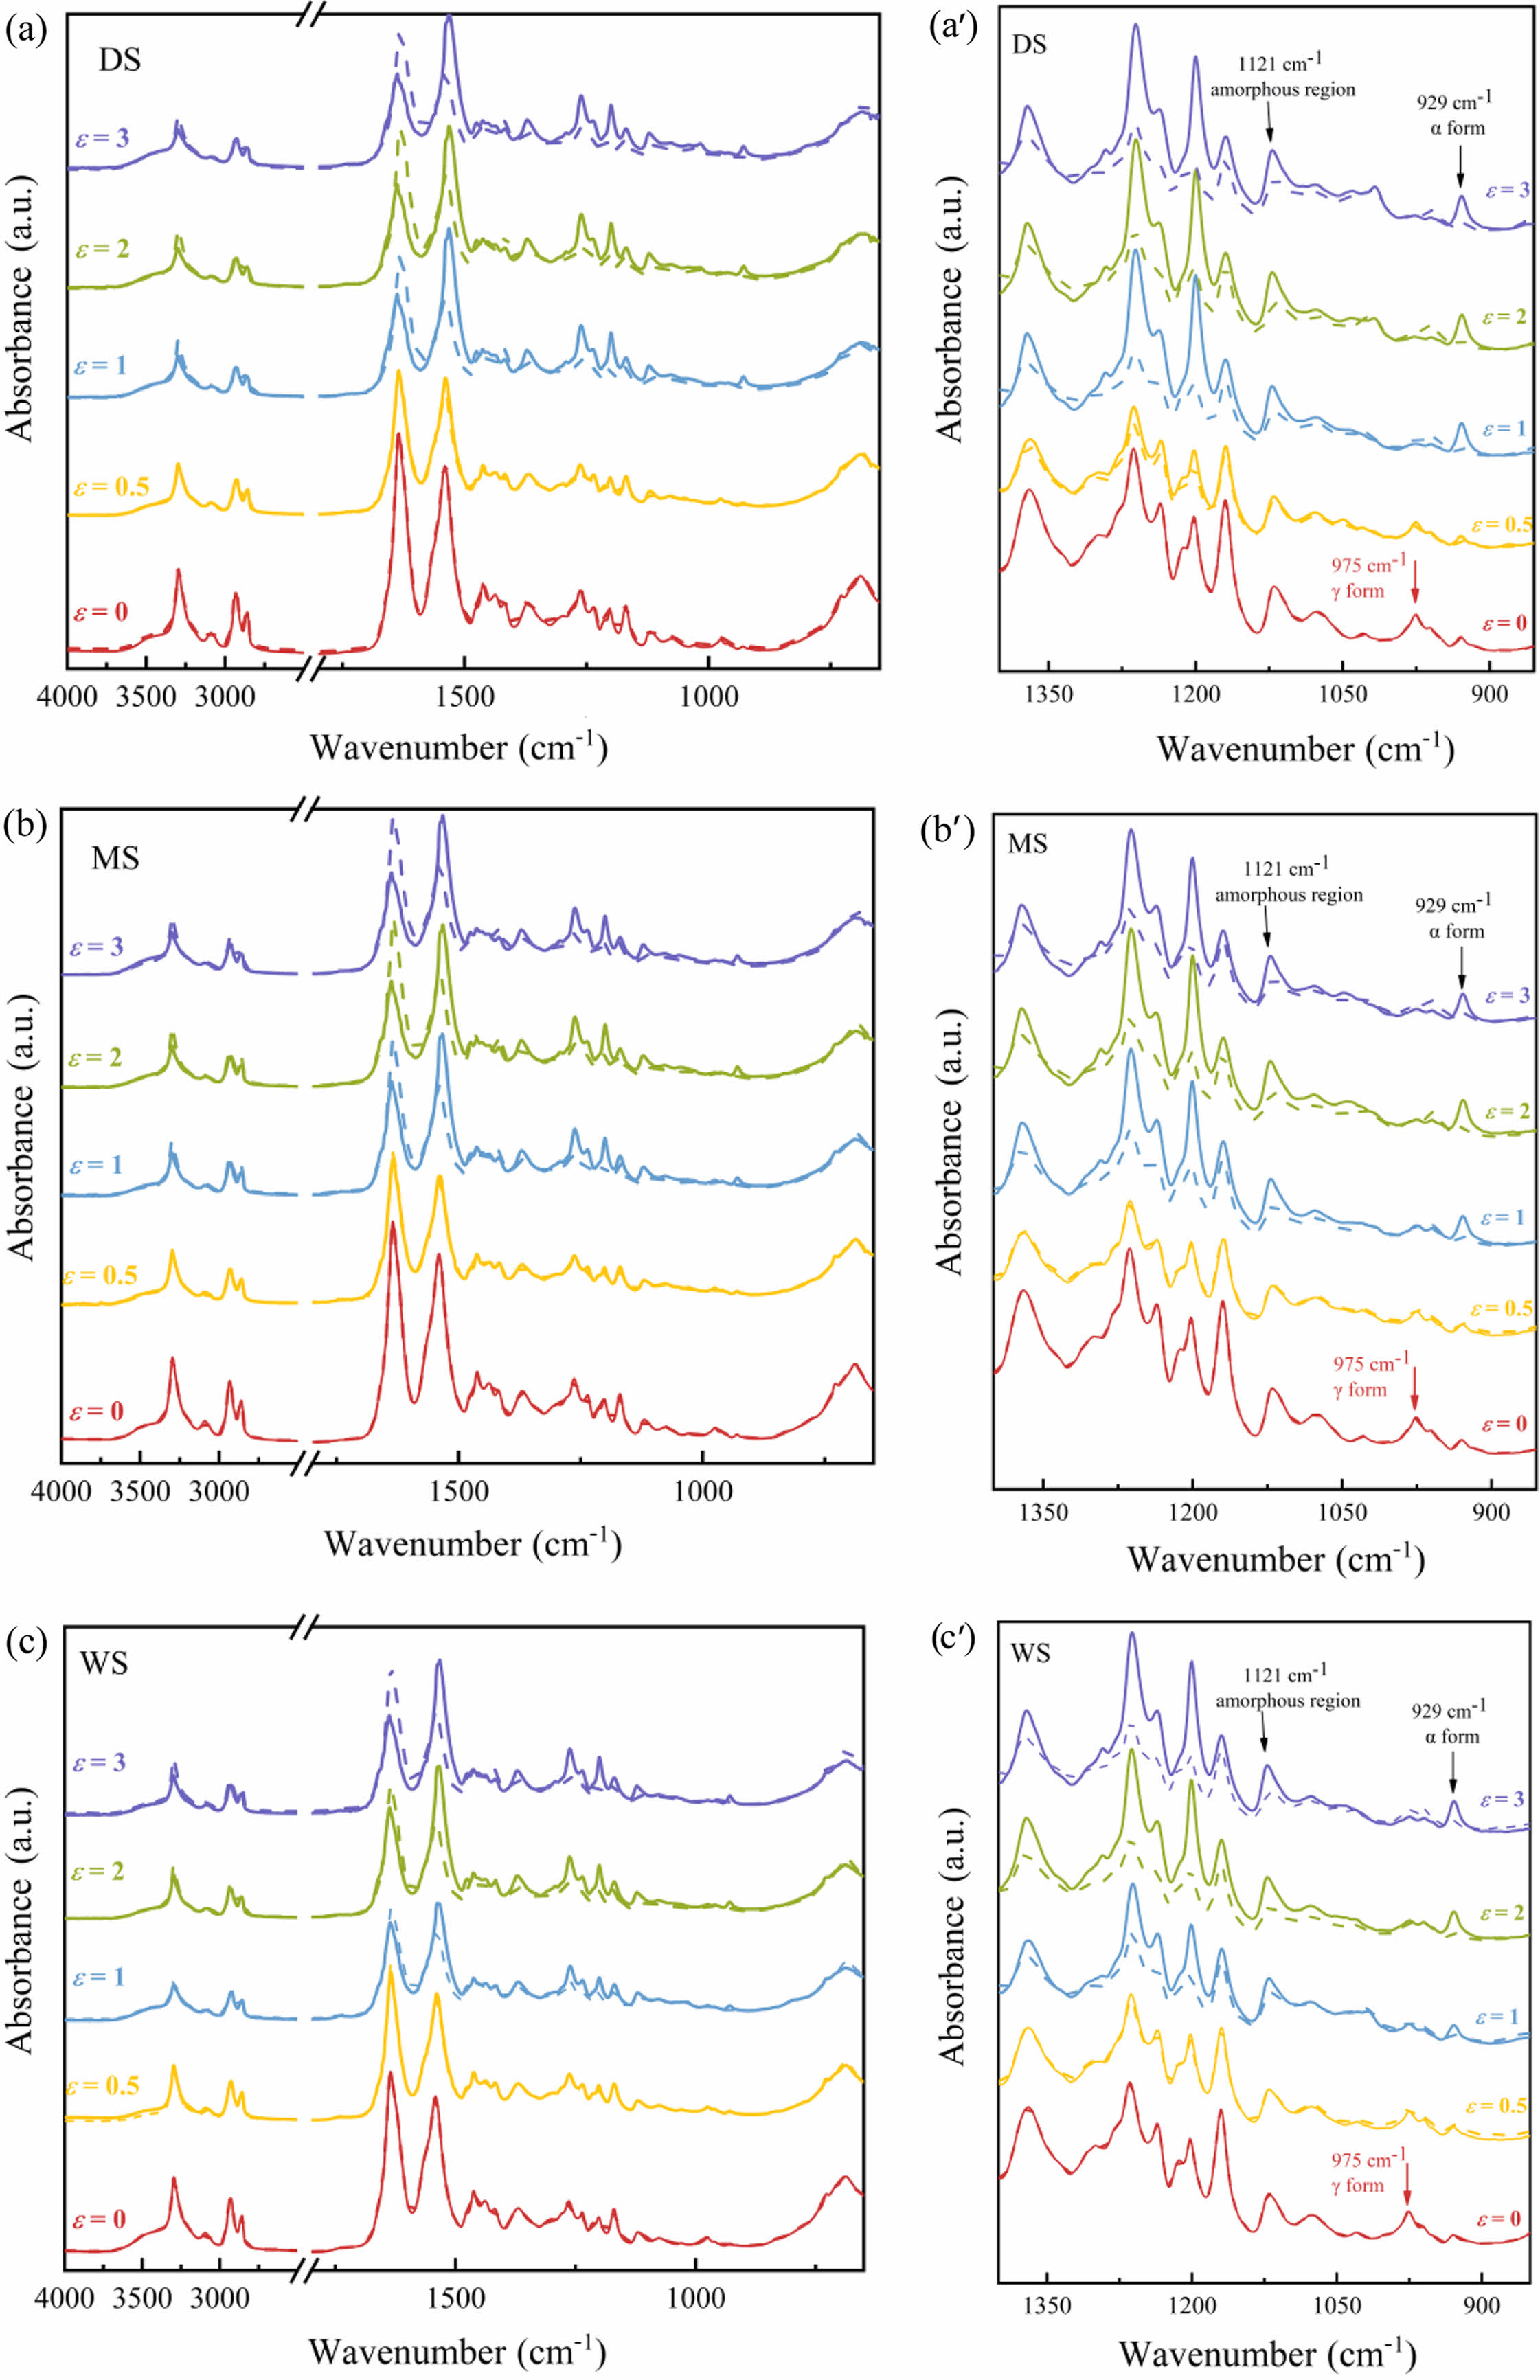
Since β is constant, the orientation degree can be represented by (D-1)/(D+2). Figure 10 shows the polarized infrared spectra of PA6 during stretching. When ε=0, the parallel and vertical bands of the spectrum are the same, indicating that the polymer skeleton is isotropic, and the molecules have not undergone orientation. As the stretching ratio increases, the absorption intensities of amide-I band and amide-II band gradually change, and the difference in intensity between parallel and vertical absorption spectra becomes more and more obvious, indicating that the degree of orientation and anisotropy of the sample continue to increase. The characteristic peak at 1645 cm-1 (amide-I band) represents the stretching vibration of C=O; The absorption peak at 1550 cm-1 (amide-II band) represents the stretching vibration of N-H. Under normal conditions, the absorption intensity of the amide-I band is higher than that of the amide-II band. As the stretching ratio increases, the PA6 molecular chains are oriented along the tensile direction gradually. After stretching, the amide-I band is arranged perpendicular to the main chain, and the amide-II band is arranged parallel to the main chain. Therefore, as the stretching ratio increases, the intensity of the amide-II band gradually exceeds that of the amide-I band, while on the vertical band, it is the opposite.
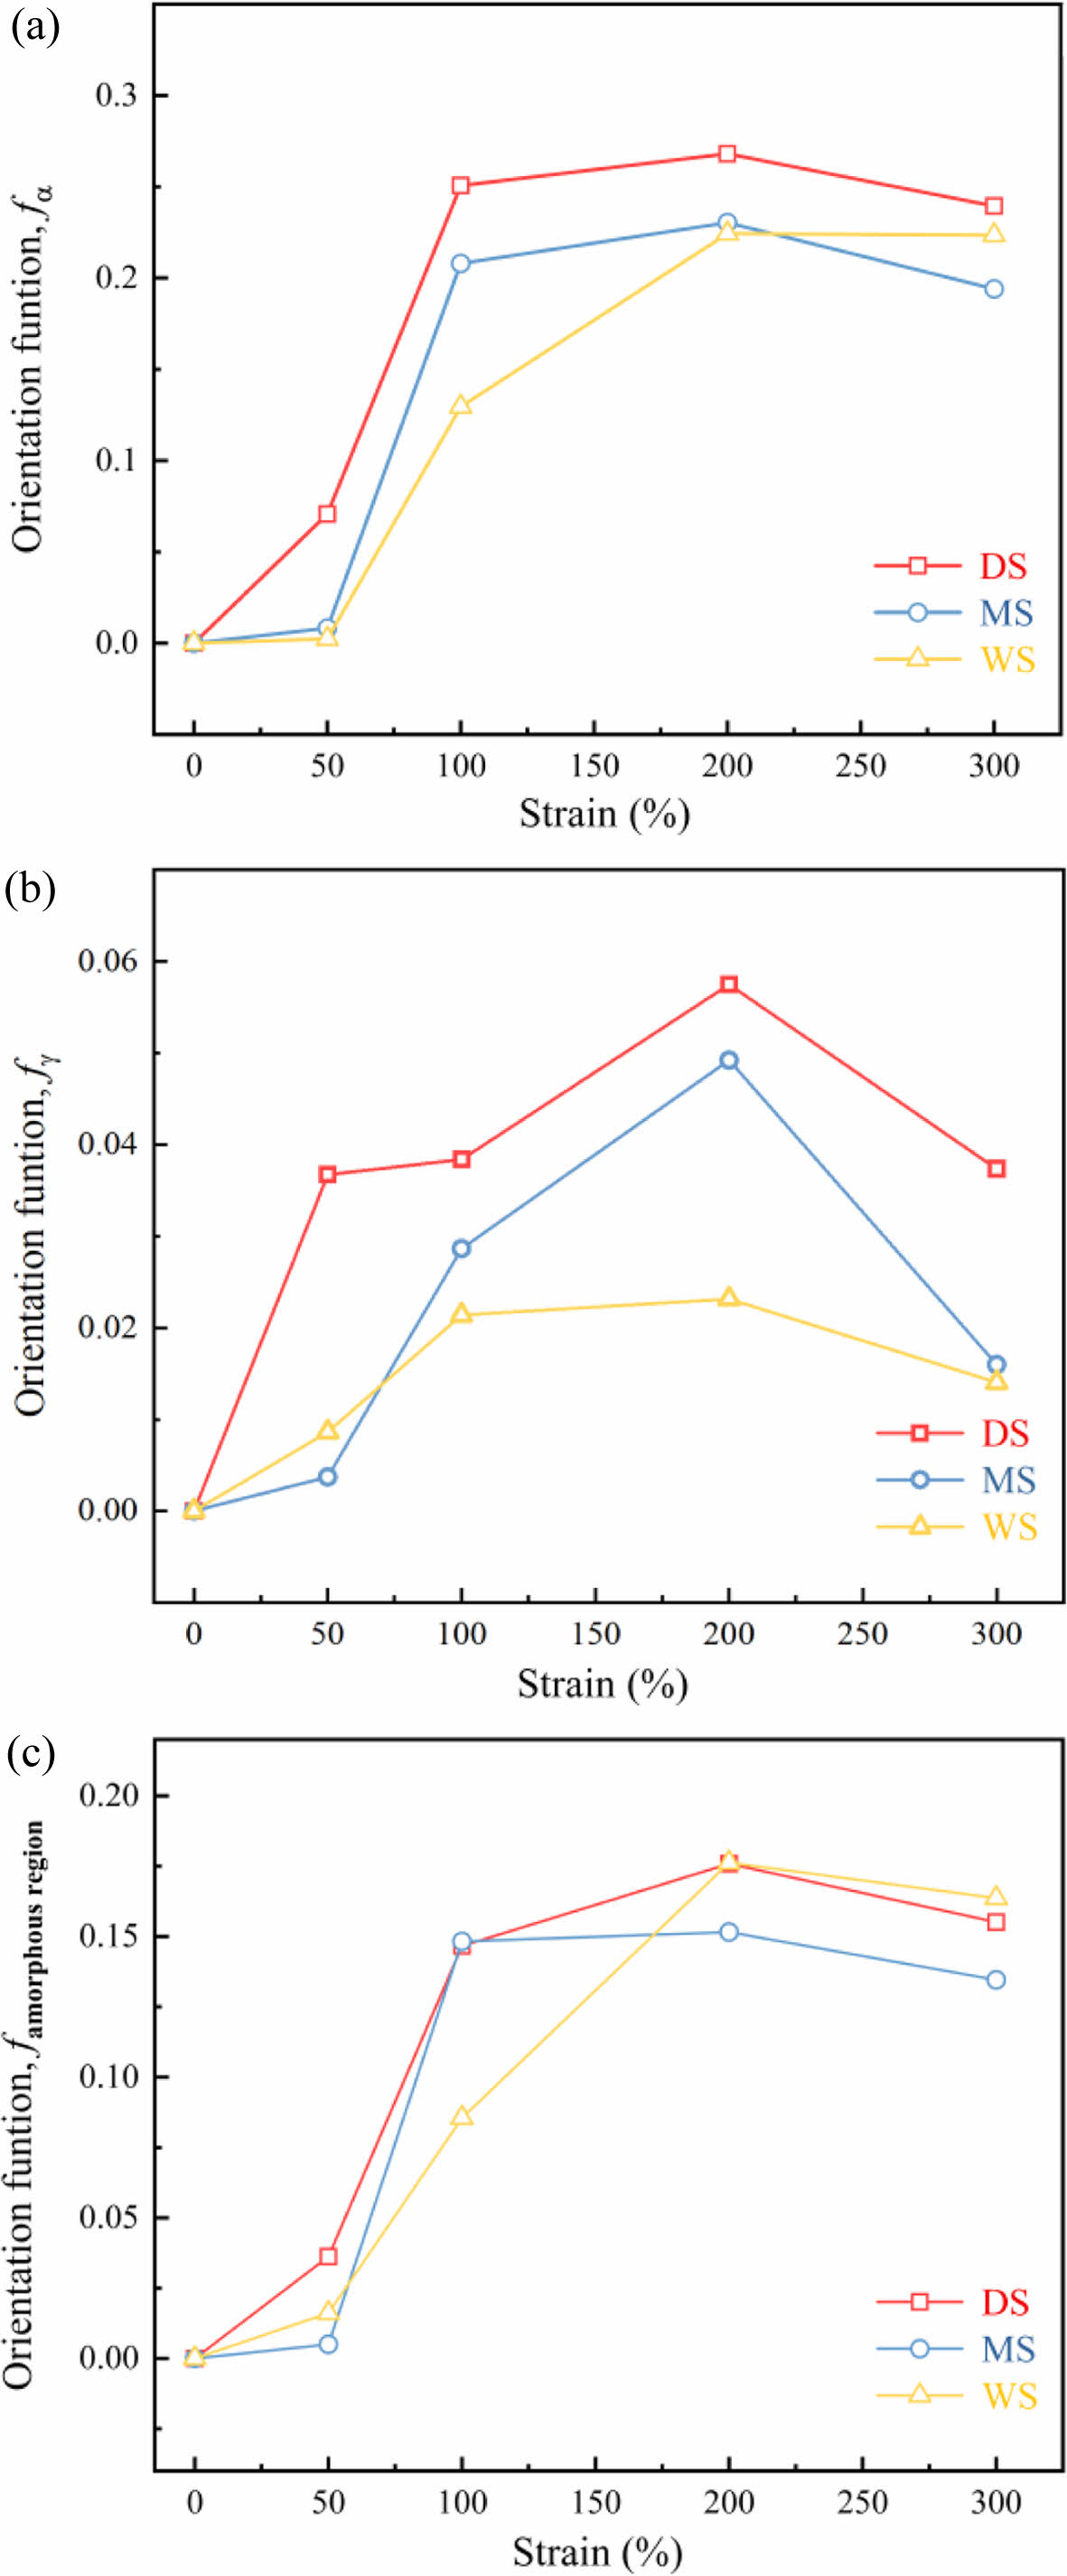
Taking (D-1)/(D+2) to represent the degree of molecular chain orientation, and choose 929 cm-1 and 975 cm-1 to describe the orientation degrees of α- and γ-phase respectively. The orientation degree of amorphous region was described by 1121 cm-1. The results are shown in Figure 11.
As the stretching ratio increases, the orientation degree of a-phase increases rapidly at low stretching ratio (e=0-100%), and tends to flatten at high elongation ratios (e>100%). Meanwhile, the orientation of g-phase increases at the beginning and then decreases. The above results indicates that during the stretching process of PA6 films, the process of lamellar and molecular chains transitioning from isotropic to highly oriented (lamellar rotation, slip orientation) mainly occurs during the strain hardening stage (e=0-100%). After that, the contribution of the high magnification stretching process afterwards to the overall orientation of the molecular chain was very weak. More importantly, when the stretching ratio reaches 50%, for MS and WS, the increase of orientation degree of a- and g-phase is lower than that of DS, which is consistent with the yield behavior of the three samples in Figure 7.
As the stretching ratio increases, three samples exhibit different stretching orientation behaviors: WS with high water content exhibits low orientation degree during stretching; while DS with low water content is faster to be oriented under stretching and its orientation degree is highest. That is to say, the lower the water content, the easier it is for the crystals to be oriented along the stretching direction during the stretching process.
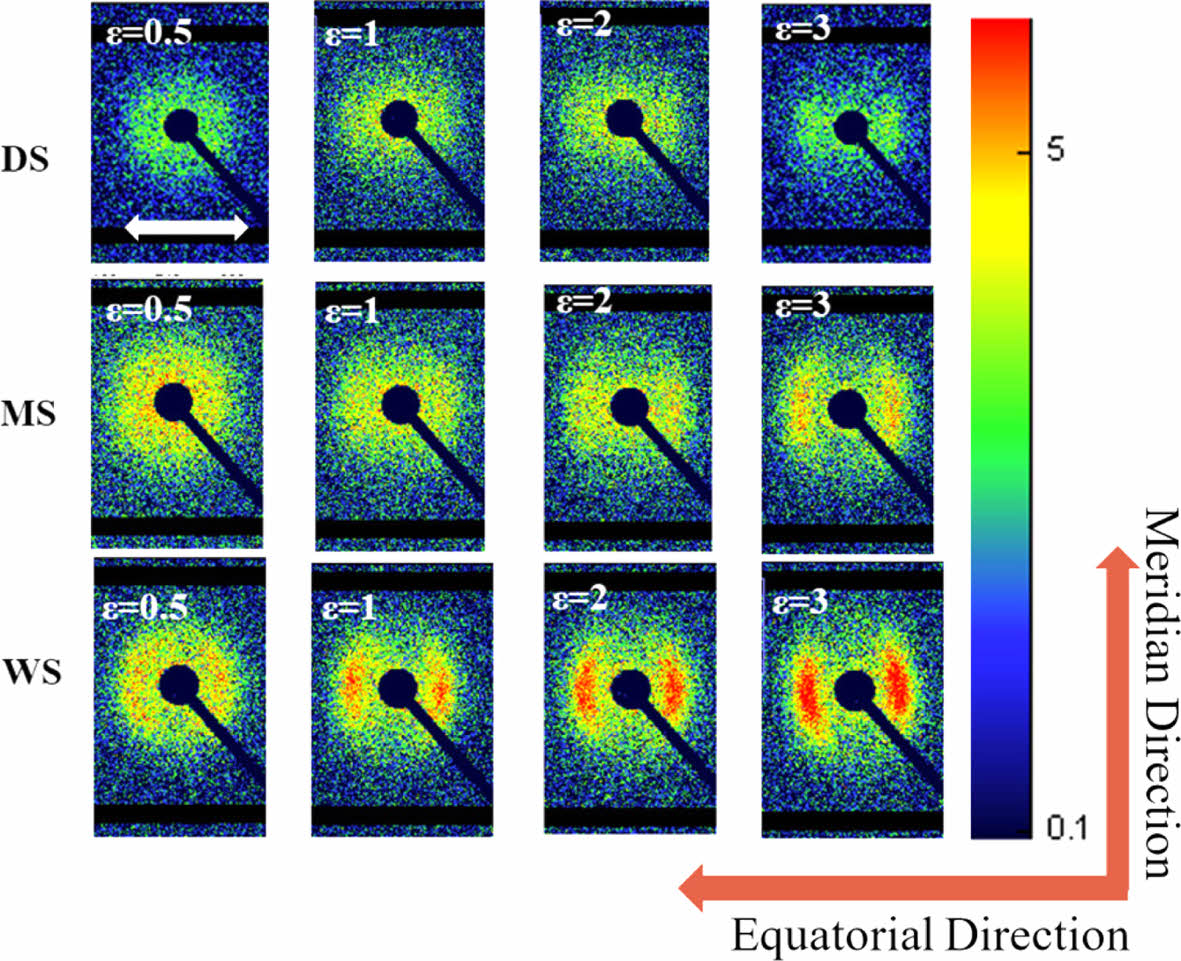
Evolution of Lamellae State During Stretching: The 2D-SAXS spectra of three types of PA6 under different stretching ratios are shown in Figure 12. The horizontal white arrow in the figure represents the stretching direction, defined as the equatorial direction, and defined perpendicular to this direction as the meridian direction. When not stretched, all three samples exhibit uniformly distributed circular rings (crystal signals) of strength, indicating that there is no pre orientation in the initial state, indicating that the samples exhibit isotropy; As the stretching ratio increases, the scattering signals of the three types of PA6 gradually gather towards the equatorial direction, indicating the formation of arranged crystal structures along the stretching direction. Perpendicular to the stretching (meridian) direction, as the stretching ratio increases, the scattering spectra of the three samples show a similar trend of change. The originally uniformly distributed circular ring crystal signal gradually weakens and disappears, but no new signal appears as the stretching strain further increases. This may be because the current tensile stress is not sufficient to form a microfiber structure network.
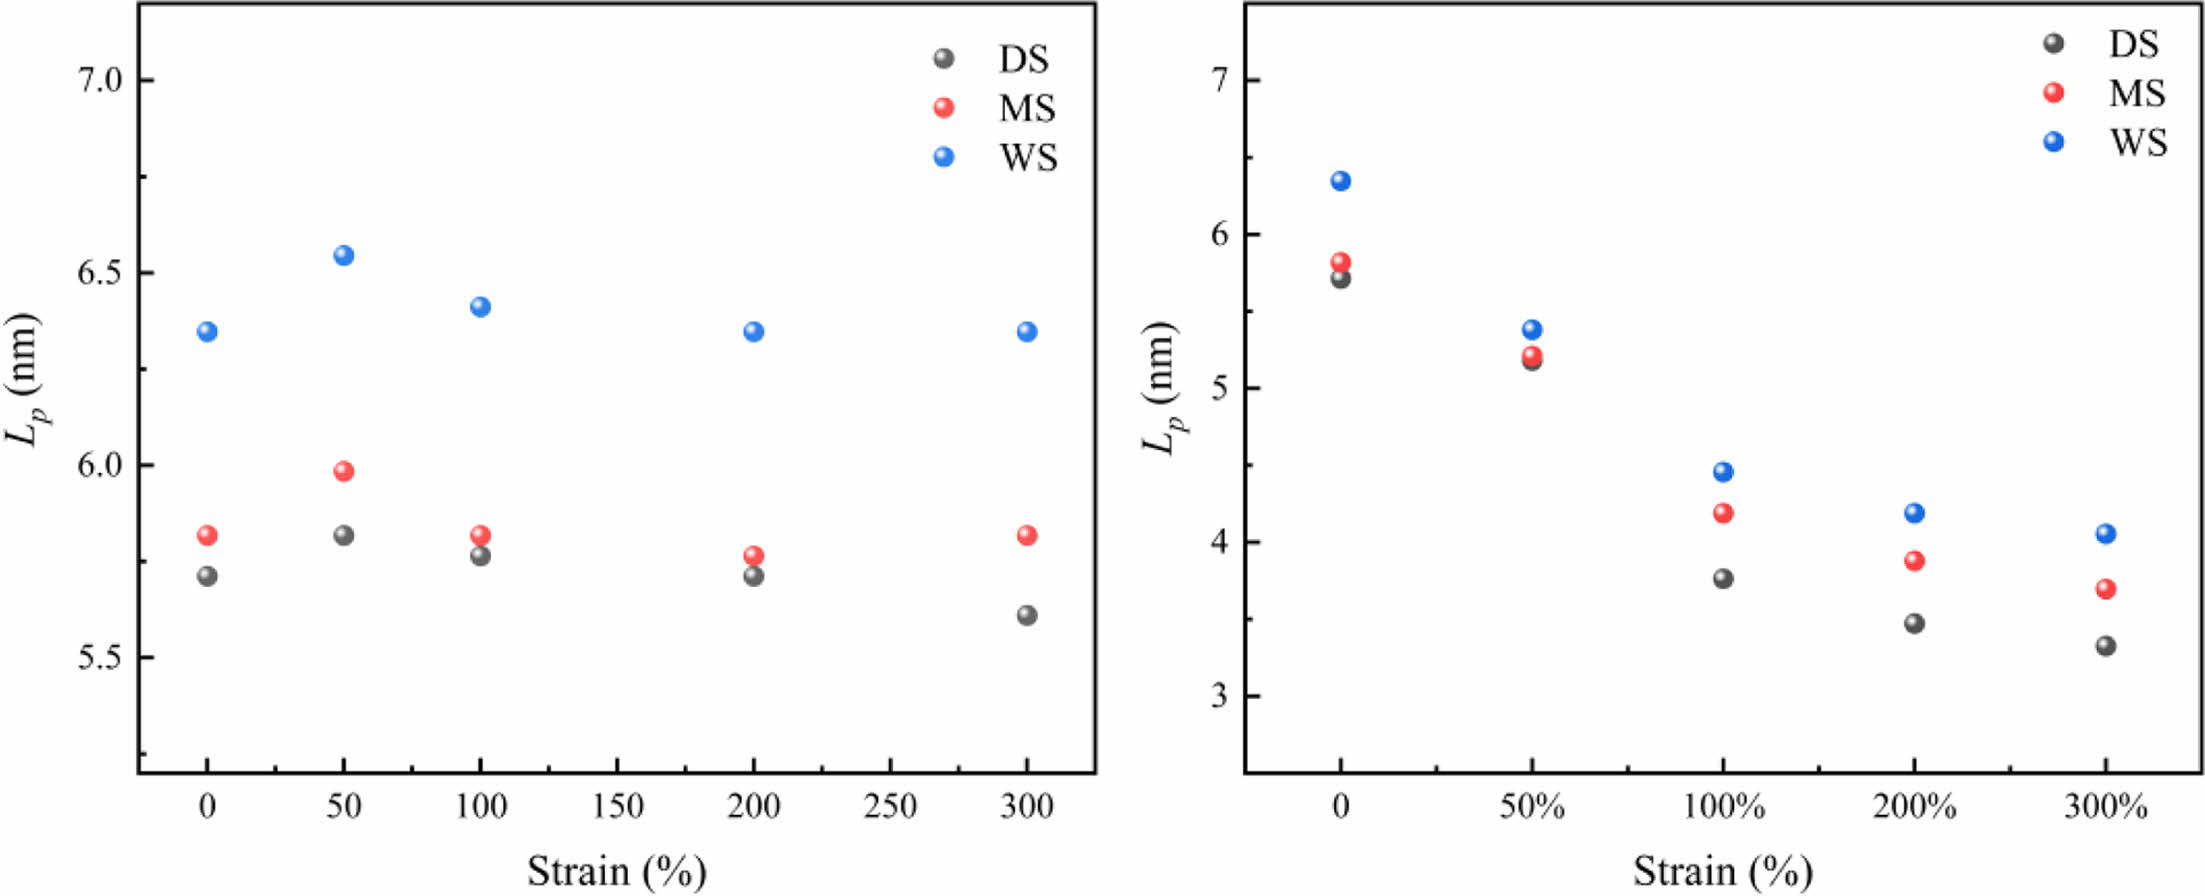
In order to elucidate the changes in crystalline orientation and long period of the PA6 samples during the stretching process, quantitative calculations were conducted on the long periods along the equatorial and meridian directions. The results are shown in Figure 13. Figure 13(a) shows the variation of the crystalline long period of three samples along the stretching direction. It can be seen that, before the strain reaches 50%, the long-period Lp in the equatorial direction increases, which then gradually decreases or remains basically unchanged. The increase in long-period Lp is mainly caused by the amorphous region. Under stress, the crystalline orientation of the amorphous region is along the stretching direction. According to the two-phase model, the amorphous region is located between adjacent crystals. Under external force, the molecular chains in the amorphous region gradually extend, and the distance between the lamellae also becomes farther. The increase in the thickness of the amorphous region is the main reason for the increase in the long-period. The decrease after the strain exceeds 50% is due to the shear, slip and fragmentation of the crystals under tensile stress, resulting in the formation of smaller sized crystals. The plateau period may be caused by a combination of strain induced spacing, slip, and crystal orientation. At this stage, distance changes in the crystals are the main factor affecting long-period, rather than changes in the amorphous region.
In Figure 13(b), on the meridian, due to tensile stress, the crystals gradually rotate and orient towards the stretching direction, resulting in a gradual decrease in the long-period Lp perpendicular to the stretching direction; It is worth noting that for WS, the long period of the flakes along the stretching direction (equator) or perpendicular to the stretching direction (meridian) is always greater than that of low water content samples throughout the stretching process. This is because they contain strong molecular chain segment movement ability, and the balance between molecular chain segment orientation and dissociation orientation is easier to dissociate, resulting in a more relaxed condensed state structure.
|
Figure 1 TGA curves of DS, MS, and WS. |
|
Figure 2 (a) FTIR spectra of PA6 samples of different content; (b) time-resolved ATR-FTIR spectra during water diffusion into PA6 samples. |
|
Figure 3 Mechanism of water sorption in PA6 samples. |
|
Figure 4 (a) TGA thermograms; (b) Melting curves; (c) XRD patterns of PA6 films with different water content. |
|
Figure 5 2D-SAXS patterns for PA6 samples of different water content. |
|
Figure 6 Temperature dependence of (a) storage modulus; (b) tan δ for different PA6 samples measured by dynamic mechanical analysis. |
|
Figure 7 (a) Engineering stress-engineering strain curves for PA 6 samples; (b) the derivate curves of stress-strain curves for DS. |
|
Figure 8 Melting curves of (a) DS; (b) MS; (c) WS at different stain ε; (d) The crystallinity of samples with different water content at different strain. |
|
Figure 9 XRD patterns of PA6 samples with different water content at various strain. |
|
Figure 10 Polarized-ATR spectra of PA6 with different water content at different strains |
|
Figure 11 Orientation function: (a) fα; (b) fγ; (c) famorphous region of PA6 samples. |
|
Figure 12 2D-SAXS patterns of PA6 samples at different strains from 0.5 to 3. |
|
Figure 13 (a) Long period of lamellae (Lp) along equatorial direction; (b) along meridian direction as a function of strain. |
|
Table 1 Long Period (Lp), Lamellar Thickness (Lc) and Amorphous Thickness (La) for PA6 Samples of Different Water Content |

This article prepared PA6 films with different water contents, and investigated the diffusion process of water molecules in PA6 films at the molecular level using time-dependent infrared spectroscopy. The influence of water on the microstructure of PA6 was investigated using TGA, XRD and DSC. Samples with different water contents were stretched to different strains, and testing methods such as DSC, XRD, polarized infrared spectroscopy and 2D-SAXS were used to investigate the effect of water content on the structural evolution of PA6 during tensile deformation. The main conclusions are drawn as follows:
(1) The diffusion of water molecules in PA6 film disrupts the hydrogen bonding between PA6 molecular chains and weakens the interactions between PA6 molecules; The difference in water content leads to differences in the initial state of the PA6 films. High water content PA6 films exhibit lower glass transition temperature, stronger molecular chain mobility, lower elastic modulus and lower yield strength on the stress-strain curve;
(2) The presence of water enhances the molecular chain mobility of PA6 and slows down the rate of crystalline orientation along the stretching direction. At the same stretching ratio, the crystallinity and orientation degree of high water content samples are always lower than those of dry samples; At the same time, the stretching deformation process of PA6 is accompanied by γ→α Phase transition: The interaction between molecules in samples with high water content is weak, and the molecular chain segments have better mobility. Its degree of phase transition that occurs during the stretching process is also higher;
(3) During the uniaxial stretching process, PA6 samples with different water contents exhibit the same trend: before the strain reaches 50%, the long period of the sample gradually increases, mainly due to the crystalline orientation along the stretching direction under tensile stress and the gradual extension of molecular chains in the amorphous region; At higher strain, the long period of all three samples decreased mainly due to the shear, slip, and fragmentation of the crystals under tensile stress, resulting in the formation of smaller crystal sizes;
(4) During the uniaxial stretching process, PA6 samples with high water content exhibit longer crystalline long period along and perpendicular to the stretching direction. This is due to their strong molecular chain segment mobility, resulting in a more relaxed structure that is more suitable for biaxial stretching.
In general, this manuscript elucidates the changes in morphology and mechanical properties of PA films with different water contents during stretching, providing key basis for material selection, engineering design, and optimization of PA 6 film processing technology in practical applications.
- 1. Li, C.; Shang, Y.; Li, J.; Jiang, S. Structure/property Relationship of Semicrystalline Polymers During Tensile Deformation: a Molecular Dynamics Approach. Colloid Polym. Sci. 2022, 300, 675-689.
-

- 2. Yan, J.; Sui, J.; Xu, Y.; Li, X.; Wang, H.; Zhang, B. Assessment of the Benthic Ecological Status in Adjacent Areas of the Yangtze River Estuary, China, using AMBI, M-AMBI and BOPA Biotic Indices. Mar. Pollut. Bull. 2020, 153, 111020.
-

- 3. Aparna, S.; Purnima, D.; Adusumalli, R. B. Effect of Short Carbon Fiber Content and Water Absorption on Tensile and Impact Properties of PA6/PP Blend Based Composites. Polym. Compos. 2020, 41, 5167-5181.
-

- 4. Liu, S. J.; Shih, C. C. An Experimental Study of the Water-Assisted Injection Molding of PA-6 Composites. J. Reinf. Plast. Comp. 2008, 27, 985-999.
-

- 5. Zhao, R. G.; Luo, W. B.; Xiao, H. M.; Wu, G. Z. Water-absorptivity and Mechanical Behaviors of PTFE/PA6 and PTFE/PA66 Blends. T. Nonferr. Metals Soc. 2006, 16, s498-s503.
-

- 6. Preda, F. M.; Alegría, A.; Bocahut, A.; Fillot, L. A.; Long, D. R.; Sotta, P. Investigation of Water Diffusion Mechanisms in Relation to Polymer Relaxations in Polyamides. Macromolecules 2015, 48, 5730-5741.
-

- 7. Shinzawa, H.; Mizukado, J. Water Absorption by Polyamide (PA) 6 Studied With Two-trace Two-dimensional (2T2D) Near-infrared (NIR) Correlation Spectroscopy. J. Mol. Struc. 2020, 1217, 128389.
-

- 8. Le Gac, P. Y.; Arhant, M.; Le Gall, M.; Davies, P. Yield Stress Changes Induced by Water in Polyamide 6: Characterization and Modeling. Polym. Degrad. Stabil. 2017, 137, 272-280.
-

- 9. Sun, M.; Chen, D.; Liu, L.; Wang, T.; Guo, Y.; Xie, Y.; Yao, W.; Yu, H. Effects of O2/CO2 Transmission Rate of BOPA/LDPE or PE Film on Shelf Life and Quality Attributes of Fresh-cut Cherry Radish. Food Biosci. 2023, 51, 102171.
-

- 10. Cerruti, P.; Laurienzo, P.; Malinconico, M.; Carfagna, C. Thermal Oxidative Stability and Effect of Water on Gas Transport and Mechanical Properties in PA6-EVOH Films. J. Polym. Sci. Polym. Phys. 2007, 45, 840-849.
-

- 11. de-la-Ossa-Carretero, J. A.; del-Pilar-Ruso, Y.; Giménez-Casalduero, F.; Sánchez-Lizaso, J. L. Testing BOPA Index in Sewage Affected Soft-bottom Communities in the North-western Mediterranean. Mar. Pollut. Bull. 2009, 58, 332-340.
-

- 12. Rozanski, A.; Galeski, A. Controlling Cavitation of Semicrystalline Polymers During Tensile Drawing. Macromolecules 2011, 44, 7273-7287.
-

- 13. Shan, G. F.;Yang, W.; Yang,M. B.; Xie, B. H.; Feng, J. M.; Fu, Q. Effect of Temperature and Strain Rate on the Tensile Deformation of Polyamide 6. Polymer 2007, 48, 2958-2968.
-

- 14. Sridhar, A.; Doddipatla, P. Influence of PP Content on Mechanical Properties, Water Absorption, and Morphology in PA6/PP Blend. J. Appl. Polym. Sci. 2019, 136, 47690.
-

- 15. Aguado-Giménez, F.; Gairín, J. I.; Martinez-Garcia, E.; Fernandez-Gonzalez, V.; Ballester Moltó, M.; Cerezo-Valverde, J.; Sanchez-Jerez, P. Application of “taxocene surrogation” and “taxonomic sufficiency” Concepts to Fish Farming Environmental Monitoring. Comparison of BOPA Index Versus Polychaete Assemblage Structure. Mar. Environ. Res. 2015, 103, 27-35.
-

- 16. Shen, B.; Hu, Y.; Song, X.; Song, Z.; Liu, J.; Sun, C.; Lu, S.; Kang, J.; Cao, Y.; Xiang, M.; Zheng, Z. Study on the Evolution Mechanism of the Structure and Properties of ABS in Cycled Fused Deposition Molding (FDM). Ind. Eng. Chem. Res. 2023, 62, 13572-13580.
-

- 17. Gao, F.; Liu, H.; Zhang, Y.; Liu, D.; Xie, Z.; Peng, W.; Song, Y.; Hu, R.; Chen, D.; Kang, J.; Xu, R.; Cao, Y.; Xiang, M. Polyamide Membrane with Nanoscale Stripes and Internal Voids for High-performance Nanofiltration. J. Membrane Sci. 2023, 671, 121406.
-

- 18. Chen, D.; Hu, R.; Song, Y.; Gao, F.; Peng, W.; Zhang, Y.; Xie, Z.; Kang, J.; Zheng, Z.; Cao, Y.; Xiang, M. Hydrophilic Modified Polydopamine Tailored Heterogeneous Polyamide in Thin-film Nanocomposite Membranes for Enhanced Separation Performance and Anti-fouling Properties. J. Membrane Sci. 2023, 666, 121124.
-

- 19. Yu,Y.; Liang, Y.; Zhang, Y.; Xie, Z.; Chen, J.; Zheng, Z.; Kang, J.; Yang, F.; Cao, Y.; Xiang, M. Characterizations and Performances of Polysulfone/graphene Oxide with Structural Defects Repaired by Cellulose Nanocrystals. Polym. Composites 2022, 43, 3446-3456.
-

- 20. Xu, R.; Gao, F.; Wu, Y.; Ding, L.; Chen, D.; Liu, T.; Yu, Y.; Zhuo, W.; Chen, Z.; Zhang, Y.; Sun, Y.; Yang, F.; Chen, J.; Cao, Y.; Kang, J.; Zheng, Z.; Xiang, M. Influences of Support Layer Hydrophilicity on Morphology and Performances of Polyamide Thin-film Composite Membrane. Sep. Purif. Technol. 2022, 281, 119884.
-

- 21. Jiang, W.; Liang, Y.; Zhang, Y.; Xie, Z.; Zhou, J.; Kang, J.; Cao, Y.; Xiang, M. Preparation of Graphene Oxide-silica Nanohybrid/Poly(lactic acid) Biaxially Oriented Films With Enhanced Mechanical Properties. Polymer 2022, 261, 125410.
-

- 22. Chen, D.; Liang, Q.; Gao, F.; Liu, T.; Wu, Y.; Zheng, Z.; Kang, J.; Xu, R.; Cao, Y.; Xiang, M. Design of High-performance Biomimetic Reverse Osmosis Membranes by Introducing Loose Liposome as An Artificial Water Channel. Chem. Eng. J. 2022, 431, 133878.
-

- 23. Run, M.; Song, H.; Yao, C.; Wang, Y. Crystal Morphology and Nonisothermal Crystallization Kinetics of Short Carbon Fiber/Poly(trimethylene terephthalate) Composites. J. Appl. Polym. Sci. 2007, 106, 868-877.
-

- 24. Chen, D.; Gao, F.; Peng, W.; Song, Y.; Hu, R.; Zheng, Z.; Kang, J.; Cao, Y.; Xiang, M. Artificial Water Channels Engineered Thin-film Nanocomposite Membranes for High-efficient Application in Water Treatment. Sep. Purif. Technol. 2022, 303, 122206.
-

- 25. Yu, Y.; Hu, Y.; Song, X.; Chen, J.; Kang, J.; Cao, Y.; Xiang, M. Investigation on Nanocomposites of Polysulfone and Different Ratios of Graphene Oxide with Structural Defects Repaired by Cellulose Nanocrystals. Polymers, 2023, 15, 3821.
-

- 26. Liu, T.; Chen, D.; Cao, Y.; Yang, F.; Chen, J.; Kang, J.; Xu, R.; Xiang, M. Construction of a Composite Microporous Polyethylene Membrane with Enhanced Fouling Resistance for Water Treatment. J. Membrane Sci. 2021, 618, 118679.
-

- 27. Xu, R.; Wang, J.; Chen, D.; Liu, T.; Zheng, Z.; Yang, F.; Chen, J.; Kang, J.; Cao, Y.; Xiang, M. Preparation and Performance of a Charge-mosaic Nanofiltration Membrane with Novel Salt Concentration Sensitivity for the Separation of Salts and Dyes. J. Membrane Sci. 2020, 595, 117472.
-

- 28. Zeng, F.; Xu, R.; Ye, L.; Xiong, B.; Kang, J.; Xiang, M.; Li, L.; Sheng, X.; Hao, Z. Effects of Heat Setting on the Morphology and Performances of Polypropylene Separator for Lithium Ion Batteries. Ind. Eng. Chem. Res. 2019, 58, 2217-2224.
-

- 29. Yu, Y.; Zeng, F.; Chen, J.; Kang, J.; Yang, F.; Cao, Y.; Xiang, M. Effects of Ordered Structure on Non-isothermal Crystallization Kinetics and Subsequent Melting Behavior of β-nucleated Isotactic Polypropylene/graphene Oxide Composites. J. Thermal. Anal. Calorim. 2019, 136, 1667-1678.
-

- 30. Strobl, G. R.; Schneider, M. Direct Evaluation of the Electron Density Correlation Function of Partially Crystalline Polymers. J. Polym. Sci. Polym. Phys.1980, 18, 1343-1359.
-

- 31. Strobl, G. R. A New Method of Evaluating Slit-smeared Small-angle X-ray Scattering Data. Acta Crystallogr. Sect. A: Found. Crystallogr. 1970, 26, 367-375.
-

- 32. Xiong, B.; Chen, R.; Zeng, F.; Kang, J.; Men, Y. Thermal Shrinkage and Microscopic Shutdown Mechanism of Polypropylene Separator for Lithium-ion Battery: In-situ Ultra-small Angle X-ray Scattering Study. J. Membrane Sci. 2018, 545, 213-220.
-

- 33. Wang, J.; Xu, R.; Yang, F.; Kang, J.; Cao, Y.; Xiang, M. Probing Influences of Support Layer on the Morphology of Polyamide Selective Layer of Thin Film Composite Membrane. J. Membrane Sci. 2018, 556, 374-383.
-

- 34. Kang, J.; Yang, F.; Chen, J.; Cao, Y.; Xiang, M. Influences of Molecular Weight on the Non-isothermal Crystallization and Melting Behavior of β-nucleated Isotactic Polypropylene with Different Melt Structures. Polym. Bull. 2017, 74, 1461-1482.
-

- 35. Kang, J.; Xiong, B.; Chen, R.; Men, Y. Initiation of Cavitation Upon Drawing of Pre-oriented Polypropylene Film: In situ SAXS and WAXD Studies. Polymer 2017, 128, 57-64.
-

- 36. Song,Y.; Chen, D.; Liu, D.; Hu, R.; Zhang, Y.; Hu, Y.; Song, X.; Gao, F.; Kang, J.; Xie, Z.; Zheng, Z.; Cao, Y.; Xiang, M. In-situ Integrated Arginine-doped Polydopamine Engineered Thin-film Nanocomposite Membranes for High Separation and Anti-fouling Reverse Osmosis. ACS Appl. Mater. Inter. 2023, 15, 56293-56304.
-

- 37. Zhang, Q.; Chen, Z.; Wang, B.; Chen, J.; Yang, F.; Kang, J.; Cao, Y.; Xiang, M.; Li, H. Effects of Melt Structure on Crystallization Behavior of Isotactic Polypropylene Nucleated with α/β Compounded Nucleating Agents. J. Appl. Polym. Sci. 2015, 132, 41355.
-

- 38. Wang, B.; Chen, Z.; Kang, J.; Yang, F.; Chen, J.; Cao, Y.; Xiang, M. Influence of Melt Structure on the Crystallization Behavior and Polymorphic Composition of Polypropylene Random Copolymer. Thermochim. Acta 2015, 604, 67-76.
-

- 39. Kang, J.; Li, X.; Xiong, B.; Liu, D.; Chen, J.; Yang, F.; Cao, Y.; Xiang, M. Investigation on the Tensile Behavior and Morphology Evolution of Isotactic Polypropylene Films Polymerized with Different Ziegler–Natta Catalysts. Adv. Polym. Technol. 2017, 36, 44-57.
-

- 40. Kang, J.; He, J.; Chen, Z.; Yang, F.; Chen, J.; Cao, Y.; Xiang, M. Effects of β-nucleating Agent and Crystallization Conditions on the Crystallization Behavior and Polymorphic Composition of Isotactic Polypropylene/multi-walled Carbon Nanotubes Composites. Polym. Adv. Technol. 2015, 26, 32-40.
-

- 41. Kang, J.; Chen, Z.; Chen, J.; Yang, F.; Weng, G.; Cao, Y.; Xiang, M. Crystallization and Melting Behaviors of the b-nucleated Isotactic Polypropylene with Different Melt Structures-the Role of Molecular Weight. Thermochim. Acta 2015, 599, 42-51.
-

- 42. Reuvers, N.; Huinink, H.; Adan, O. Water Plasticizes Only a Small Part of the Amorphous Phase in Nylon-6. Macromol. Rapid Comm. 2013, 34, 949-953.
-

- 43. Essabir, H.; Rodrigue, D.; Bouhfid, R.; Qaiss, A. Effect of Nylon 6 (PA6) Addition on the Properties of Glass Fiber Reinforced Acrylonitrile-butadiene-styrene. Polym. Composites 2018, 39, 14-21.
-

- 44. Stuart, B. H. A Fourier Transform Raman Study of Water Sorption by Nylon 6. Polym. Bull. 1994,33, 681-686.
-

- 45. Zhong, L.; Ren, X.; Yang, S.; Chen, E.; Sun, C.; Stroeks, A.; Yang, T. Lamellar Orientation of Polyamide 6 Thin Film Crystallization on Solid Substrates. Polymer 2014,55, 4332-4340.
-

- 46. Xu, Y.; Wu, P. A Study of Water Dehydration in Nylon 6 as a Function of Temperature Using Two-dimensional (2D) Correlation Near-infrared (NIR) Analysis. J. Mol. Struct. 2007, 833, 145-149.
-

- 47. Vasanthan, N. Determination of Molecular Orientation of Uniaxially Stretched Polyamide Fibers by Polarized Infrared Spectroscopy: Comparison of X-ray Diffraction and Birefringence Methods, Appl. Spectrosc. 2005, 59, 897-903.
-

- 48. Jiang, W.; Sun, C.; Zhang, Y.; Xie, Z.; Zhou, J.; Kang, J.; Cao, Y.; Xiang, M. Preparation of Well-dispersed Graphene Oxide-silica Nanohybrids/poly(lactic acid) Composites by Melt Mixing. Polym. Test., 2023, 118, 107912.
-

- 49. Jiang, W.; Chen, D.; Xie, Z.; Zhang, Y.; Hu, B.; Kang, J.; Cao, Y.; Xiang, M. Exploring the Size Effect of Graphene Oxide on Crystallization Kinetics and Barrier Properties of Poly(lactic acid). ACS Omega, 2022, 7, 42, 37315-37327.
-

- 50. Lee, K.; Kim, K.; Pesapane, A.; Kim, H.; Rabolt, J. Polarized FTIR Study of Macroscopically Oriented Electrospun Nylon-6 Nanofibers. Macromolecules 2008, 41, 1494-1498.
-

- 51. An, J.; Zhang,Y.; Zhang, X.; He, M.; Zhou, J.; Zhou, J.; Liu, Y.; Chen, X.; Hu, Y.; Song, X.; Chen, J.; Wu, T.; Kang, J.; Xie, Z. Structure and Properties of Epoxy Resin/Graphene Oxide Composites Prepared from Silicon Dioxide-Modifed Graphene Oxide. ACS Omega, 2024, 9, 17577-17591.
-

- 52. An, J.; Chen, Z.; Xie, Z.; Zhou, J.; He, M.; Liu, Y.; Zhang, Y.; Han, L.; Kang, J.; Wu, T.; Chen, J.; Xiang, M. Preparation and Properties of Flexible Dual-network High-performance Epoxy Composites. Polymer 2024, 127621.
-

- Polymer(Korea) 폴리머
- Frequency : Bimonthly(odd)
ISSN 2234-8077(Online)
Abbr. Polym. Korea - 2024 Impact Factor : 0.6
- Indexed in SCIE
 This Article
-
2025; 49(2): 222-235
Published online Mar 25, 2025
- 10.7317/pk.2025.49.2.222
- Received on Oct 10, 2024
- Revised on Nov 25, 2024
- Accepted on Dec 4, 2024
 Services
- Full Text PDF
- Abstract
- ToC
- Conflict of Interest
Introduction
Experimental
Results and Discussion
Conclusions
- References
Shared
 Correspondence to
- Yi Zhang
-
*Chongqing Industry Polytechnic College, Chongqing 401120, China
**State Key Laboratory of Polymer Materials Engineering, Polymer Research Institute of Sichuan University, Chengdu 610065, China - E-mail: nsno1@163.com
- ORCID:
0000-0001-9701-6452


 Copyright(c) The Polymer Society of Korea. All right reserved.