


- Quantitative Evaluation of the Yellowing Polyurethane Foam by Fourier-Transform Infrared (FTIR) Spectroscopy
Won-Hwa Park*, **,†
 and Jang-Seok Park*
*Materials Research Team, Daehan Solution, 369, Namdongdae-ro, Beon-gil, Incheon 21629, Korea
**Current Address: R&D Center, OCSmaterials, 109, Anaji-ro, Gyeyang-gu, Incheon 21104, Korea- 푸리에 적외선 분광법을 이용한 폴리우레탄 폼 황변 정량화 평가
박원화*, **,†
· 박장석**㈜대한솔루션 소재개발팀, **현소속: ㈜옥스머티리얼즈 연구소
Reproduction, stored in a retrieval system, or transmitted in any form of any part of this publication is permitted only by written permission from the Polymer Society of Korea.
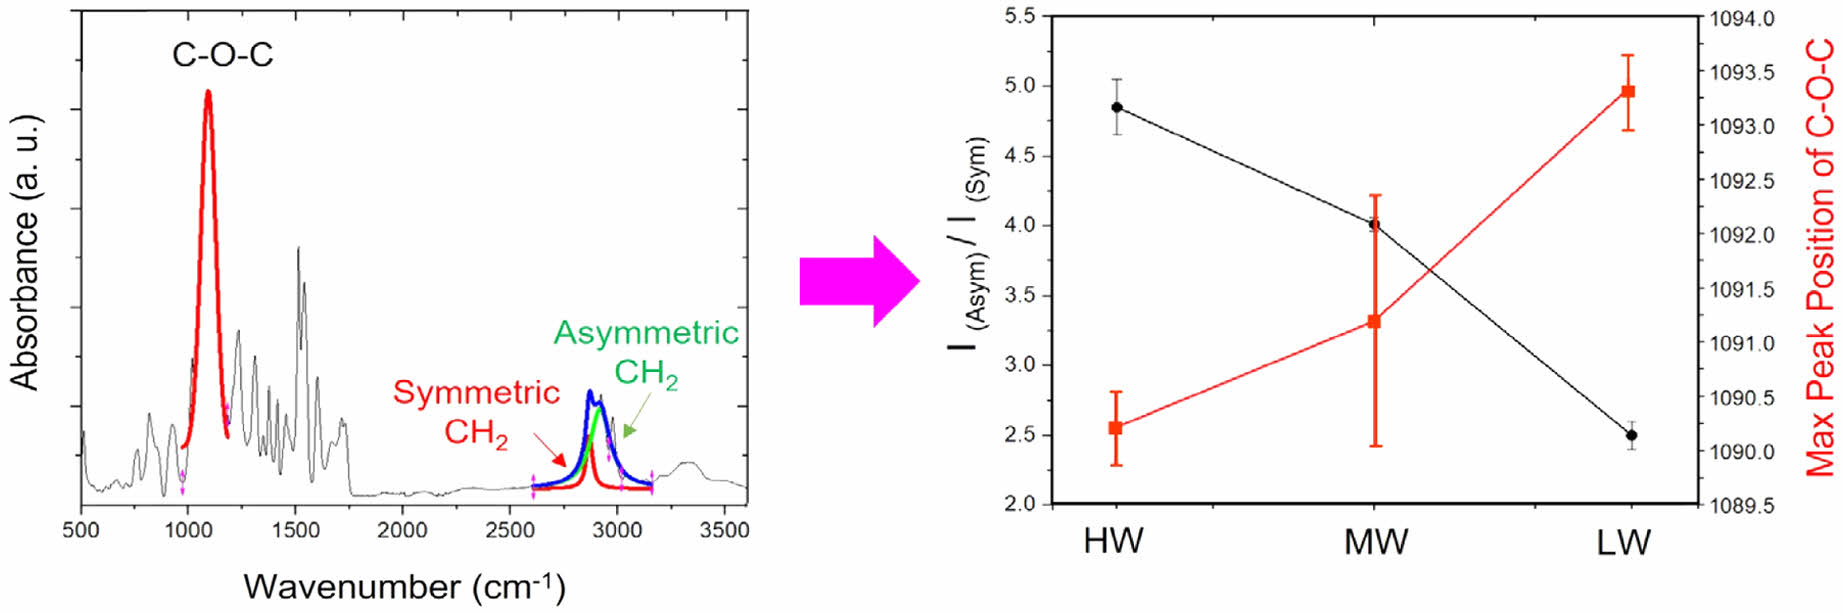
Unwanted discoloration in various materials is a significant issue, often compromising their unique prop- erties. Polymer composites, in particular, are highly susceptible to environmental factors such as light exposure, thermal conditions, and oxidation, which can lead to discoloration. In this study, we aim to quantitatively assess the degree of yellowing in polyurethane foam (PUF), a crucial material for sound absorption in the automotive industry. Fourier-trans- form infrared spectroscopy (FTIR) spectra are obtained for each sample, revealing significant spectral differences between more yellowed and less yellowed PUF samples. Specifically, the intensity ratio I(asymmetric CH2 at 2900 cm-1) / I(symmetric CH2 at 2850 cm-1) is investigated to quantitatively differentiate the degree of yellowing in each PUF sam- ple. A higher I(asymmetric CH2 at 2900 cm-1) / I(symmetric CH2 at 2850 cm-1) value indicates a greater degree of yel- lowing in PUF. This can be attributed to the asymmetric CH2 bonds in PUF, which act as chromophores. Their structural asymmetry creates conditions that favor strong absorption of light, resulting in visible discoloration, such as yellowing or other chromophoric behaviors. Also, we found that the anti-correlation between yellowing and red-shifting of C- O-C leads to more deformation of PUF. This experimental anti-correlation phenomenon between higher I(asymmetric CH2 at 2900 cm-1) / I(symmetric CH2 at 2850 cm-1) and red-shift of C-O-C peak position change can substantiate the degree of yellowing more evidently. This work may pave the way for providing insights into the original polyurethane deformation (e.g., discoloring, yellowing), which may not be apparent through visual inspection alone.
다양한 재료에서 원하지 않는 변색은 중요한 문제로, 종종 그들의 고유한 특성을 손상시킨다. 특히 폴리머복합재는 빛 노출, 열적 조건 및 산화와 같은 환경적 요인에 매우 민감하여 변색을 초래할 수 있다. 본 연구에서는 자동차 산업에서 음향 흡수를 위해 중요한 재료인 폴리우레탄 폼(polyurethane foam, PUF)의 변색 정도를 정량적 으로 평가하는 것을 목표로 한다. 푸리에 적외선 분광법(Fourier transform infrared spectroscopy, FTIR) 스펙트럼을 각 샘플에 대해 얻어, 변색이 더 심한 PUF 샘플과 덜 변색된 PUF 샘플 사이에서 중요한 스펙트럼 차이를 확인한다. 특히, 비대칭 CH2 결합(2900 cm-1)과 대칭 CH2 결합(2850 cm-1)의 강도 비율 I(비대칭 CH2 at 2900 cm-1)/I(대 칭 CH2 at 2850 cm-1)를 조사하여 각 PUF 샘플의 변색 정도를 정량적으로 구분하여 한다. I(비대칭 CH2 at 2900 cm-1) / I(대칭 CH2 at 2850 cm-1) 값이 높을수록 PUF의 변색 정도가 더 크다는 것을 의미한다. 이는 염색단으로 작용하는 비대칭 CH2 결합 때문이다. 이러한 구조적 비대칭성은 빛을 강하게 흡수하는 조건을 만들고, 결과적으로 황 변이나 다른 염색단 거동과 같은 visible dislocation을 초래한다. 우리는 C-O-C의 황변 및 적색 시프트 간의 반 상관관계가 PUF의 많은 변형을 초래한다는 사실을 알아내었다. I(비대칭 CH2 at 2900 cm-1) / I(대칭 CH2 at 2850 cm-1)의 값이 높고, C-O-C 피크 위치의 적색편이 변화하는 실험적 반비례 현상은 변색 정도를 더 명확히 입증할 수 있다. 본 연구는 시각적 검사만으로는 명확하지 않은 폴리우레탄의 원래 변형(예: 변색, 황변)에 대한 통찰을 제공할 수 있는 길을 열어줄 수 있다.
Development of new characterization metrology for quantitatively estimating the degree of yellowing via Fourier-transform infrared spectroscopy (FTIR) spectroscopy. A higher I (asymmetric CH2 at 2900 cm-1) / I (symmetric CH2 at 2850 cm-1) value indicates a greater degree of yellowing in polyurethane foam (PUF). Moreover, the direct experimental anti-correlation phenomenon between higher I (asymmetric CH2 at 2900 cm-1) / I (symmetric CH2 at 2850 cm-1) and red-shift of C-O-C peak position change can substantiate the degree of yellowing more evidently.
Keywords: polyurethane foam, yellowing, Fourier-transform infrared spectroscopy, chromophore.
The authors thanks the president of DAEHAN SOLUTION, Mr. Hyheon Kwon.
The authors declare that there is no conflict of interest.
Polyurethane plays a pivotal role in various industries as a versatile material capable of adjusting flexibility and strength to suit diverse applications. It is widely utilized in manufac- turing mechanical parts and structures due to its exceptional strength and durability.1,2 In the furniture industry, polyure- thane is employed for crafting foam pads, sheets, and cushions and serves as a material for footwear in the fashion sector. Additionally, it serves as an adhesive to fortify architectural structures with robust bonding materials.3,4 Specifically, poly- urethane foam (PUF), produced through a chemical reaction between isocyanate and polyol, is instrumental in fabricating automotive seats, steering wheels, interior components, and more. Its attributes include durability, lightweight properties, and excellent sound absorption capabilities.5-7 One critical element for improving sound absorption performance involves actively controlling the open cell size of PUF in a hierarchical man- ner.8-10 Adjusting the mixing ratio between isocyanate and polyol or incorporating additives such as catalysts or surfac- tants into the polyol has been encouraged to enhance PUF's sound absorption performance in automobiles. Yuan and col- leagues investigated the incorporation of Al2O3 nanoparticles.11 They found that filling PUF with Al2O3 nanoparticles effec- tively enhances sound absorption performance in the low-fre- quency range by creating larger single cavity holes. Research by Shafig and co-workers explored the acoustic behavior of wood fibers.12 They demonstrated that increasing the thick- ness with higher filler loading (~20%) improves the sound absorption coefficient (α), attributed to forming a structure with relatively smaller pore sizes (open cells) in PUF. Lee and colleagues investigated the tuning effect of sound absorption frequency by adjusting the open cell size in PUF through graphene oxide (GO) impregnation.13 They highlighted that sound-absorbing properties can be significantly enhanced by GO impregnation. Specifically, the properties can be tailored to maximize absorption within specific frequency ranges by varying the density of GO impregnation, utilizing its ability to navigate tortuous paths and longer passages even at the same thickness. Apart from achieving hierarchical open cell formation, another critical challenge in enhancing sound absorp- tion performance is addressing discoloration events, such as yellowing in polyurethane foam (PUF).14-16 Yellowing signi- fies chemical changes or degradation in the material, potentially altering its physical properties, including porosity, density, and elasticity, all of which can impact sound absorption char- acteristics. Yellowing in PUF is primarily attributed to expo- sure to light (including UV), heat, and oxidation processes. It often results from the breakdown of chemical bonds within the foam's structure, leading to the formation of chromophores
(molecules responsible for color) due to surrounding light irra- diation.17,18 Various methods have been proposed for quanti- tatively assessing the degree of yellowing in PUF. Thermal analysis techniques such as differential scanning calorimetry (DSC) and thermogravimetric analysis (TGA) can evaluate the thermal stability and decomposition behavior of PUF.19,20 However, these methods do not directly provide information on yellowing associated with chemical structural changes. Colorimetry is another method suggested for estimating the degree of yellowing in PUF. However, it requires a reference sample to obtain quantitative information, which can introduce uncertainties and potential errors. Spectroscopic analysis using UV-Visible spectroscopy is also a viable approach for quan- titatively evaluating the degree of yellowing in PUF. Yellowing involves the formation of chromophores that absorb light at specific wavelengths. UV-Visible spectroscopy can quantify these absorption changes, offering a measure of yellowing inten- sity. Nevertheless, quantifying yellowing based solely on single absorption peak intensity in UV-Visible spectroscopy may introduce systematic errors due to variations in sample thick- ness, position, and weight, potentially hindering exact quan- titative comparisons.
Here, we aim to develop a new and straightforward charac- terization method to quantify the degree of yellowing using Fourier-transform infrared spectroscopy (FTIR). FTIR spectra are capable of detecting functional groups associated with oxi- dation or degradation products that contribute to yellowing.
Changes in peak intensities or shifts in absorption bands can indicate the extent of yellowing. Specifically, we utilize the intensity ratio I (asymmetric CH2 at 2900 cm-1) / I(symmetric CH2 at 2850 cm-1) to quantitatively and simply assess the degree of yellowing in PUF. This ratio serves as a representative measure because changes in the intensity of these bands reflect alterations in the polymer structure due to aging, degradation, or exposure to environmental factors. This structural change can lead to the formation of chromophores and subsequent emission of yellow color. Normalizing intensity between these two bands minimizes systematic errors, enhancing the reliability of the method.
Polyol and methylene diphenyl diisocyanate (MDI) were purchased from BASF Korea. Various additives, including cat- alysts, surfactants, and chain extenders, were incorporated into the polyol. The liquid polyol and MDI were mixed at a specific ratio and then poured simultaneously into an open paper mold to produce free-rise polyurethane foam (PUF). Subsequently, the PUF was allowed to cure at room temperature for 48 hours. Samples were then cut into specific sizes for Attenuated Total Reflection (ATR) type FTIR experiments, as shown in Scheme 1. ATR-FTIR, which is a very convenient system for obtaining not only liquid- but solid type samples such as film and foam, is employed for obtaining IR spectrum from PUF samples. The spectral resolution is 2 cm-1 and the FTIR spectra are obtained by 4 times accumulation.
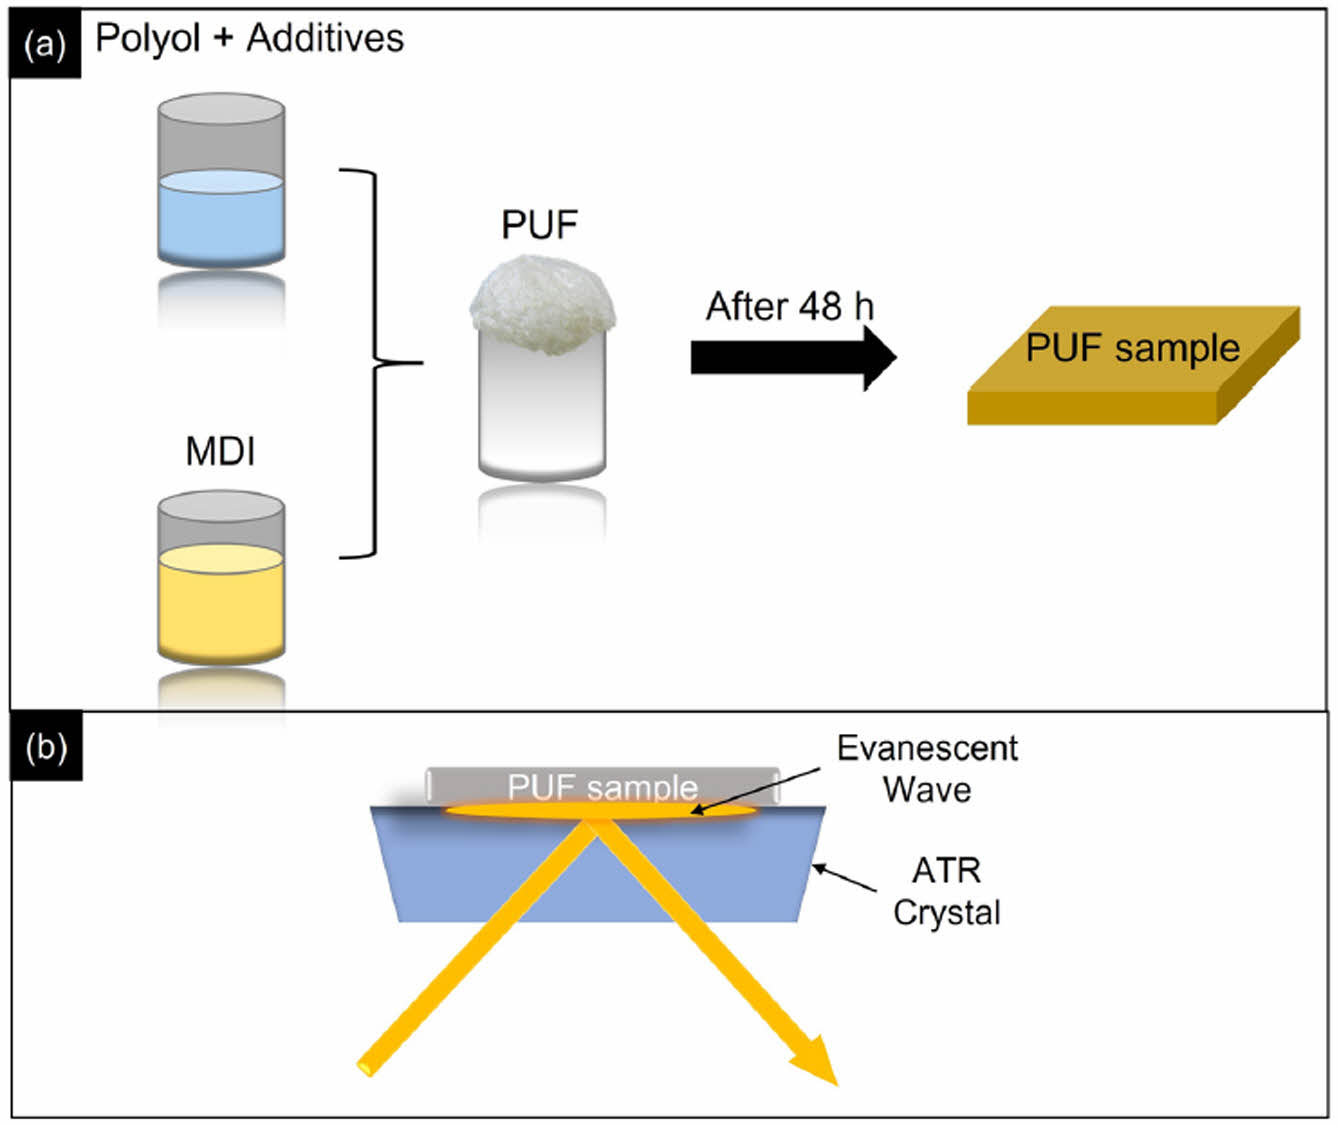
Scheme 1. (a) shows the schematic image for producing PUF from mixing between polyol+additives and methylene diphenyl diisocyanate (MDI); (b) after 48 h curing time, the PUF samples are loaded onto the ATR crystal to obtain FTIR spectrum.
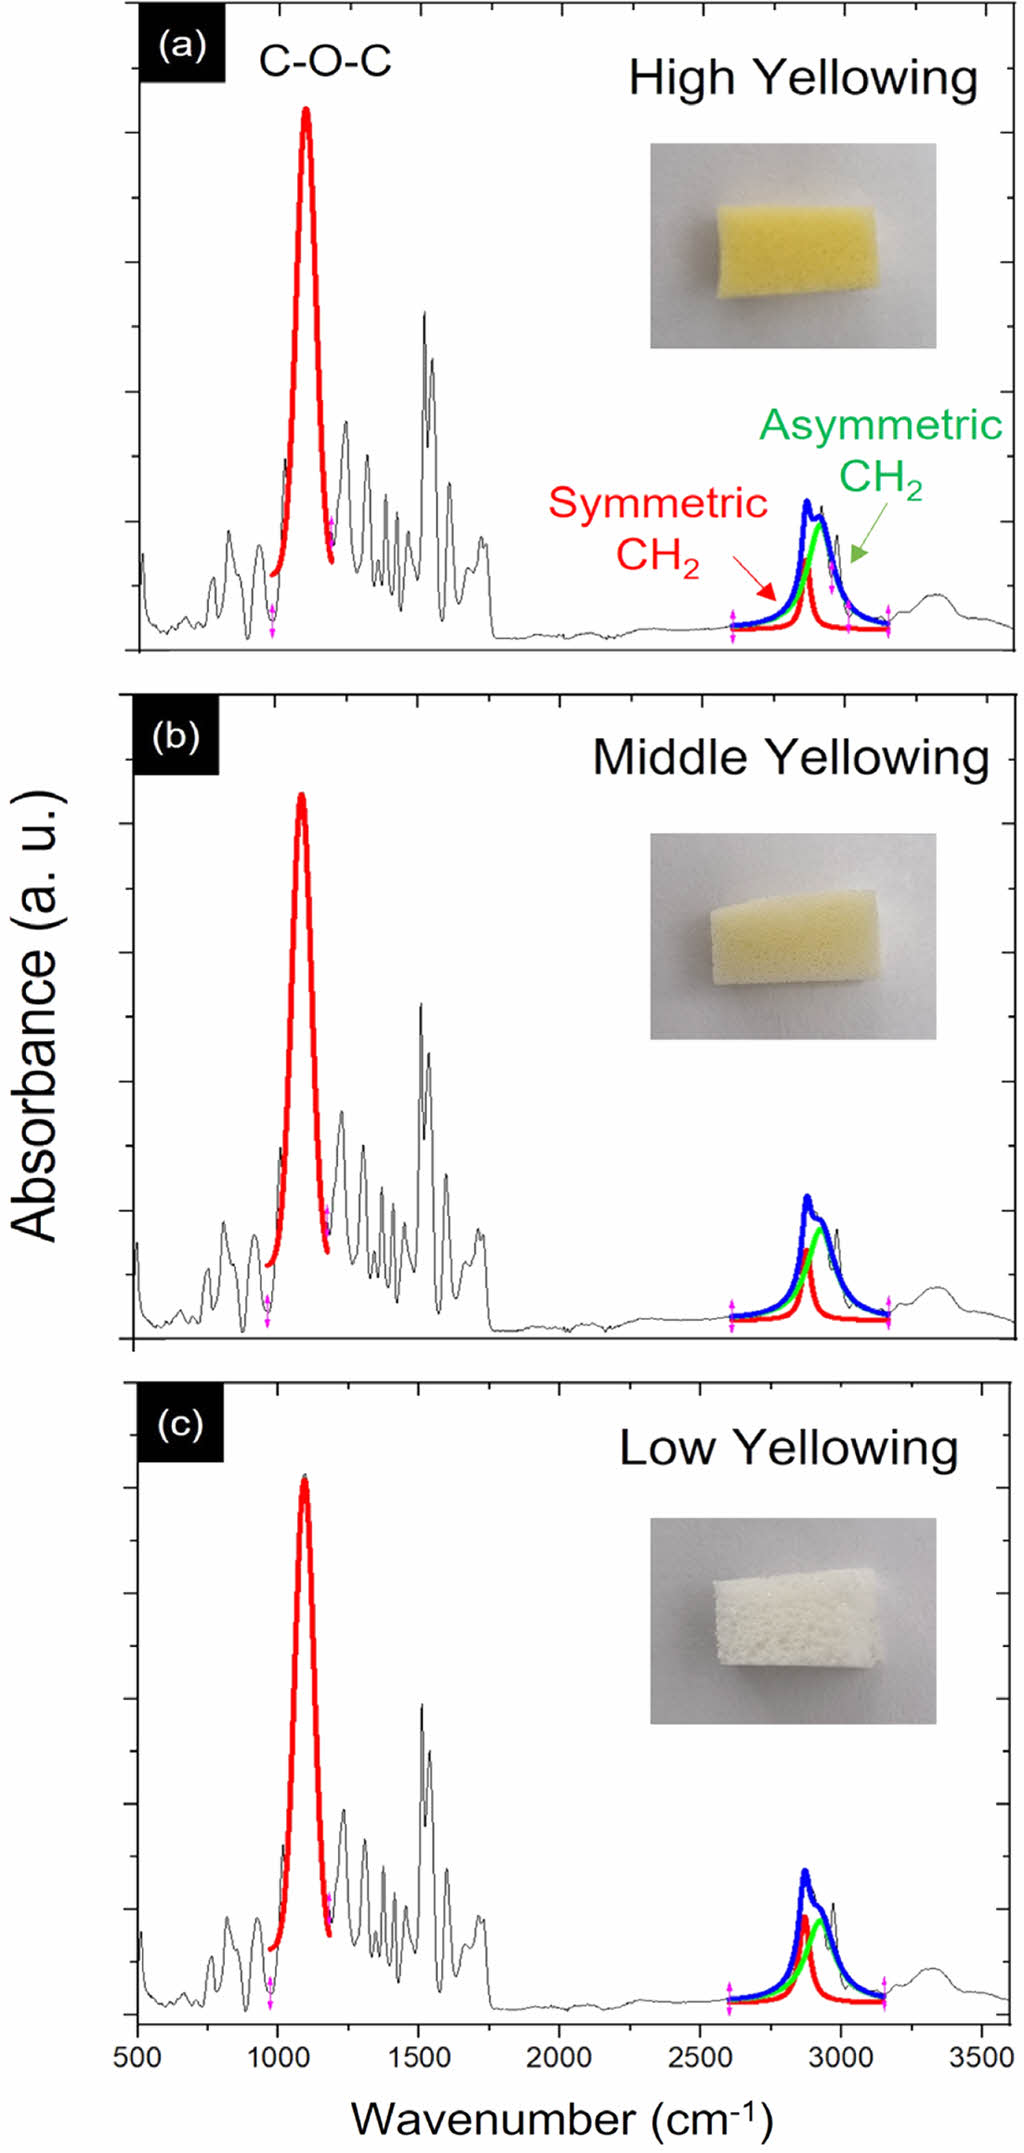
Figure 1 shows the representative FTIR spectra obtained from the High Yellowing (HY), Middle Yellowing (MY), and Lower Yellowing (LY) of the PUF samples. The inset images display the samples used to obtain the corresponding FTIR spectra. The PUF samples used in this work are prepared by varying the illumination time: approximately 10 days for the high yellowing (HY) samples, 4 days for the middle yellowing (MY) samples, and a few hours for the low yellowing (LY) samples. First of all, during the formation of polyurethane, iso- cyanates (–NCO groups, ~2270 cm-1) react with alcohols (–OH groups) to form urethane linkages (–NH–COO–). This reaction consumes the isocyanate groups. When the NCO peak disap- pears or decreases significantly in the FTIR spectrum, it usu- ally means that the isocyanate groups have been used up in the reaction, indicating the formation of polyurethane linkages. Thus, a reduction or disappearance of the NCO peak can be associated with a higher degree of polyurethane linkage forma- tion in this work. Previously, Tarkiewicz and colleagues reported on yellowing issues of PUF due to varying storage tempera- tures over 10 weeks.16 They demonstrated that differential scan- ning calorimetry (DSC) indicated an average increase in the
glass transition temperature (Tg) by 15% and 80% for samples heated at 40 ℃ and 80 ℃, respectively. However, their work did not include qualitative or quantitative characterization of
yellowing. Singh and colleagues explored the relationship between photo-oxidation and PUF yellowing.21 They suggested that the transformation of MDI with π-electrons played a cru-
cial role in yellowing under visible light irradiation. While their research was valuable in uncovering the chemical reaction mechanisms behind PUF yellowing, appropriate characteri- zation methods were not specified. Building on these previous studies,16,21 we propose a straightforward method for charac- terizing PUF yellowing using FTIR. Initially, the region from 2800 to 2950 cm-1 in Figure 1 is selected to analyze the intensity ratio between asymmetric CH2 and symmetric CH2, which are deconvoluted as green and red curves, respectively. The C-O-C peak (at 1090 cm-1, skeletal bond of polyurethane) is also fitted as a single peak to determine its maximum position, while the symmetric and asymmetric CH2 bonds are deconvoluted into red and green curves. Specifically, we can use the ratio of inten- sities between the asymmetric CH2 band at 2900 cm-1 and the symmetric CH2 band at 2850 cm-1 to quantitatively assess the degree of yellowing in PUF, defined as, I (asymmetric CH2 at 2900 cm-1, green curve) / I (symmetric CH2 at 2850 cm-1, ref curve). Indeed, chemical degradation involves changes in the molecu- lar structure of PUF, where the CH2 stretching bands in FTIR spectra are particularly sensitive to alterations in the polymer's chemical environment and structure. The asymmetric CH2 band (around 2900 cm-1) and the symmetric CH2 band (around 2850 cm-1) are especially informative in this regard. The variations in these bands can indicate structural changes due to oxidation.
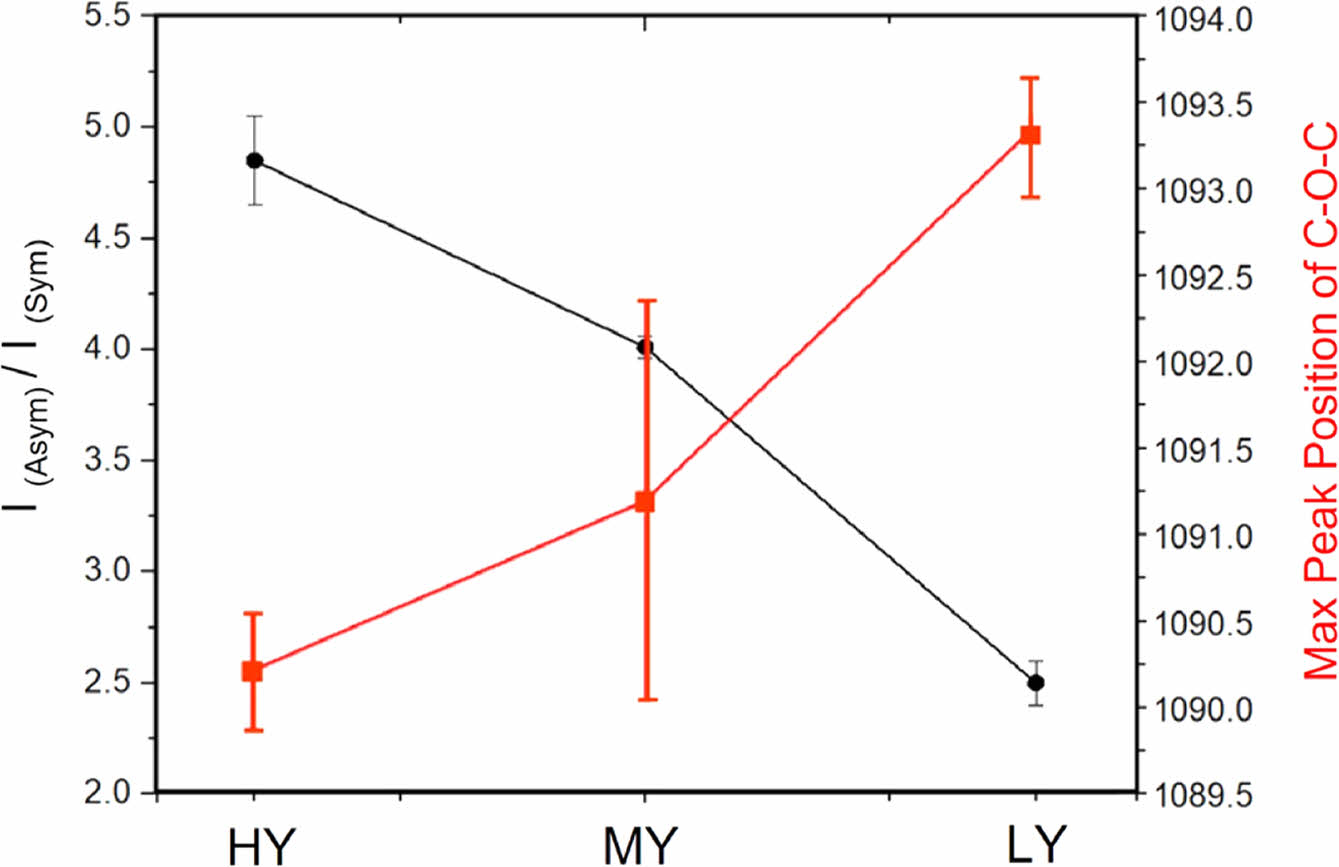
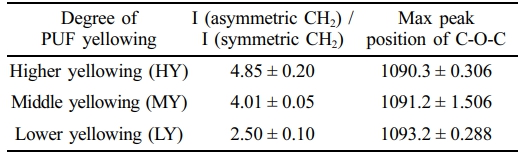
The ratio I(asymmetric CH2 at 2900 cm-1) / I(symmetric CH2 at 2850 cm-1) serves as a quantitative metric of yellow- ing, which inversely correlates with changes in the maximum peak position of the C-O-C stretching vibration band (The maximum position value of each C-O-C band is obtained by single gaussian peak fitting). The C-O-C stretching vibration band is a skeletal feature of polyurethane, a class of polymers formed by the reaction of diisocyanates with polyols, resulting in a urethane linkage (-NHCOO-) in their backbone structure. The C-O-C bonds primarily originate from the polyol com- ponent during polyurethane synthesis.18,22 In cases of yellowing, an increase in the ratio of I (asymmetric CH2 at 2900 cm-1)
/ I (symmetric CH2 at 2850 cm-1) is often observed due to the
formation of conjugated double bonds or other unsaturated
groups that absorb more strongly in the region of the asym- metric CH2 band. Table 1 summarizes the values of I (asym- metric CH2 at 2900 cm-1) / I(symmetric CH2 at 2850 cm-1) and the corresponding maximum peak positions of the C-O-C peaks. The range of change in the I(asymmetric CH2 at 2900 cm-1)
/ I (symmetric CH2 at 2850 cm-1) ratio is wider than that of the maximum peak position of C-O-C. Nevertheless, a clear anti-correlation between them can be observed. In other words, a higher value of the I (asymmetric CH2 at 2900 cm-1) / I (symmetric CH2 at 2850 cm-1) can be indicative of the for- mation of chromophores in PUF. During oxidative degrada- tion of PUF, such as exposure to oxygen or UV light, chemical changes occur in the polymer structure. This can lead to the formation of conjugated double bonds or other unsaturated groups, which are often associated with chromophores.15,20
Such changes are consistent with the red-shift of the C-O-C peak position; higher yellowing indicating higher chemical degradation and a greater probability of chromophore formation may exhibit weaker bond strength in the skeletal back-bone C-O-C band of PUF, as shown in Figure 2. The exact position of this peak can be influenced by the chemical environment and structural changes within the PUF, causing a shift towards lower wavenumbers (red-shift) in the FTIR spectrum.
|
Figure 1 (a, b, c) show the FTIR spectra obtained from the high yellowing (HY), middle yellowing (MY), and low yellowing (LY) PUF samples, respectively. The PUF samples corresponding to each spectrum are displayed in the respective insets. The peaks at ~1090 cm-1 in each spectrum is fitted as a single peak, while the symmetric and asymmetric CH2 bonds are deconvoluted into red and green curves. |
|
Figure 2 Anti-correlation between I(asymmetric CH2 at 2900 cm-1) / I(symmetric CH2) and the maximum peak position of C-O-C peak is exhibited. |
In this study, we propose a method to quantitatively assess the degree of yellowing in polyurethane foam (PUF). Fourier- Transform Infrared Spectroscopy (FTIR) spectra were obtained for each PUF sample, revealing significant spectral differences
between more and less yellowed samples. Specifically, we inves- tigated the intensity ratio of the I (asymmetric CH2 at 2900 cm-1)
/ I (symmetric CH2 at 2850 cm-1) to differentiate the degree of yellowing in PUF samples. A higher value of the I (asymmetric CH2 at 2900 cm-1) / I (symmetric CH2 at 2850 cm-1) indicates a greater degree of yellowing in PUF. Furthermore, we observe a direct experimental anti-correlation between higher the I (asymmetric CH2 at 2900 cm-1) / I (symmetric CH2 at 2850 cm-1) and a red-shift in the C-O-C peak position, which pro- vides further substantiation of the degree of yellowing.
- 1. Ates, M.; Karadag, S.; Eker, A. A.; Eker, B. Polyurethane Foam Materials and Their Industrial Applications. Polym Int. 2022, 71, 1157-1163.
-

- 2. Suleman, M. S.; Khan, S.; Gull, N.; Aleem, W. A Comprehensive Short Review on Polyurethane Foam. Int. J. Innov. Sci. Res. 2014, 12, 165-169.
- 3. Zhang, X. Y.; Wang, G.; Liy, D.; Wang, Y. Application of Rigid Polyurethane Foam Insulation Materials in Architectural Energy Conservation. Adv. Mat. Res. 2013, 608-609, 1783-1785.
-
- 4. Członka, S.; Sienkiewicz, N.; Kairytė, A.; Vaitkus, S. Colored Polyurethane Foams with Enhanced Mechanical and Thermal Properties. Polym. Test. 2019, 78, 105986.
-
- 5. Zangiabadi, Z.; Hadianfard, M. J. The Role of Hollow Silica Nanospheres and Rigid Silica Nanoparticles on Acoustic Wave Absorption of Flexible Polyurethane Foam Nanocomposites. J. Cellular Plastics. 2020, 56, 395-410.
-
- 6. Kim, M.; Kwon, D.; Lee, S.; Lim, B.; You, H. Development of Automobile Seat Comfort Estimation Models based on Polyurethane Foam. J. Ergon. Soc. Korea. 2022, 41, 277-284.
-
- 7. Huang, S.; Li, Y.; Zhu, J.; Tsai, D. P. Sound-Absorbing Materials. Phys. Rev. Applied. 2023, 20, 010501.
-
- 8. Zwinselman, J. J.; Bachmann, W. D. Polyurethane Foams for Sound and Vibration Dampening in Automotive Applications. J. Cellular Plastics. 1988, 24, 274-283.
-
- 9. Gwon, J. G.; Kim, S. K.; Kim, J. H. Sound Absorption Behavior of Flexible Polyurethane Foams with Distinct Cellular Structures. Mater. Des. 2016, 89, 448-454.
-
- 10. Choe, H.; Sung, G.; Kim, J. H. Chemical Treatment of Wood Fibers to Enhance the Sound Absorption Coefficient of Flexible Polyurethane Composite Foams. Compos. Sci. Technol. 2018, 156, 19-27.
-
- 11. Yuan, B.; Fang, X.; Liu, J.; Liu, Y.; Zhu, R. Improved Sound Absorption Properties in Polyurethane Foams by the Inclusion of Al2O3 Nanoparticles. Shock. Vib. 2021, 8010391.
-
- 12. Azahari, M. S. M.; Rus, A. Z. M.; Zaliran, M. T.; Kormin, S. Improving Sound Absorption Property of Polyurethane Foams Doped with Natural Fiber. IOP Conf. Ser.: Mater. Sci. Eng. 2017, 226 012009.
-
- 13. Lee, J.; Jung, I. Tuning Sound Absorbing Properties of Open Cell Polyurethane Foam by Impregnating Graphene Oxide. Appl. Acoust. 2019, 151, 10-21.
-
- 14. Buruiana, E. C.; Buruiana, T.; Airinel, A.; Robila, G.; Grecu, I. Synthesis and Some Properties of Polyurethane Cationomers with Side Chain Azoaromatic Chromophores. Polym. J. 1999, 31, 510- 515.
-
- 15. Wang, J.; Yan, R.; Hu, Y.; Du, G.; Liao, G.; Yang, H.; Luo, Y.; Zheng, X.; Chen, Y.; Wang, S.; Li, X. Density-Dependent Emission Colors from a Conformation-Switching Chromophore in Polyurethanes. Angew. Chem. Int. Ed. 2022, 61, e202112290.
-
- 16. Barszczewska-Rybarek, I.; Jaszcz, K.; Chladek, G.; Grabowska, P.; Okseniuk, A.; Szpot, M.; Zawadzka, M.; Sokołowska, A.; Tarkiewicz, A. Characterization of Changes in Structural, Physicochemical and Mechanical Properties of Rigid Polyurethane Building Insulation After Thermal Aging in Air and Seawater. Polym. Bull. 2022, 79, 3061-3082.
-
- 17. Bruckmoser, K.; Resch, K. Investigation of Ageing Mechanisms in Thermoplastic Polyurethanes by Means of IR and Raman Spectroscopy. Macromol.Symp. 2014, 339, 70-83.
-
- 18. Zhong, Y.; You, G.; Cai, S.; Yang, B. QUV Accelerated Aging Effects on the Structure and Properties of Polyether Polyurethane Fibers. Mater. Sci. Eng. 2019, 562, 012043.
-
- 19. Gómez-Rojo, R.; Alameda, L.; Rodríguez, A.; Calderón V.; Gutiérrez- González, S. Characterization of Polyurethane Foam Waste for Reuse in Eco-Efficient Building Materials. Polymers 2019, 562, 359.
-
- 20. Liang, S.; Zhu, Y.; Wang, H.; Wu, T.; Tian, C.; Wang, J.; Bai, R. Preparation and Characterization of Thermoregulated Rigid Polyurethane Foams Containing Nanoencapsulated Phase Change Materials. Ind. Eng. Chem. Res. 2016, 55, 2721-2730.
-
- 21. Singh, R. P.; Tomer, N. S.; Bhadraiah, S. V. Photo-oxidation Studies on Polyurethane Coating: Effect of Additives on Yellowing of Polyurethane. Polym.Degrad.Stabil. 2001, 73, 443-446.
-
- 22. Bahadur, A.; Shoaib, M.; Saeed, A.; Iqbal, S. FTIR Spectroscopic and Thermal Study of Waterborne Polyurethane-acrylate Leather Coatings Using Tartaric Acid as An Ionomer. e-Polymers. 2016, 16, 463-474.
-
- Polymer(Korea) 폴리머
- Frequency : Bimonthly(odd)
ISSN 2234-8077(Online)
Abbr. Polym. Korea - 2025 Impact Factor : 1.0
- Indexed in SCIE
 This Article
-
2025; 49(5): 531-535
Published online Sep 25, 2025
- 10.7317/pk.2025.49.5.531
- Received on Aug 6, 2024
- Revised on Oct 14, 2024
- Accepted on Oct 31, 2024
Services
- Full Text PDF
- Abstract
- ToC
- Acknowledgements
- Conflict of Interest
Introduction
Experimental
Results and Discussion
Conclusions
- References
Shared
Correspondence to
- Won-Hwa Park
-
*Materials Research Team, Daehan Solution, 369, Namdongdae-ro, Beon-gil, Incheon 21629, Korea
**Current Address: R&D Center, OCSmaterials, 109, Anaji-ro, Gyeyang-gu, Incheon 21104, Korea - E-mail: s952151@gmail.com
- ORCID:
0009-0001-5350-8014
Hyecheon Building(Room 601), #354, Gangnam-Daero, Gangnam-Gu, Seoul 06242, Korea
TEL : 82-2-568-3860, 561-5203, 569-3860 FAX : 82-2553-6938 E-mail: polymer@polymer.or.kr