







- HLB Value Gap Effects of Polyglyceryl Type Surfactant on MCT Oil-in-Water Emulsions
Seung Bum Lee, Se Mi Park, and Young-Bong Choi*,**,†

Department of Chemical Engineering, Dankook University, Yongin 16890, Korea
*Department of Chemistry, College of Science & Technology, Dankook University,
119 Dandae-ro, Dongnam-gu, Cheonan-si, Chungnam 31116, Korea
**Department of Cosmedical Materials, College of Bio-convergence, Dankook University, 119 Dandae-ro, Dongnam-gu, Cheonan-si, Chungnam 31116, Korea- 폴리글리세릴계 계면활성제의 HLB값 차이에 따른 MCT Oil-in-Water 유화액의 유화 특성
이승범 · 박세미 · 최영봉*,**,†
단국대학교 화학공학과, *단국대학교 화학과, **단국대학교 코스메디컬소재학과
Reproduction, stored in a retrieval system, or transmitted in any form of any part of this publication is permitted only by written permission from the Polymer Society of Korea.
This study evaluated the effect of the hydrophilic-lipophilic balance (HLB) value gap in mixed surfactants, using polyethylene glycol (PEG)-free surfactants of the polyglyceryl (PG) type, on the emulsification characteristics and stability of MCT Oil-in-Water emulsions. A central composite design (CCD) was conducted, setting the mixed surfactant HLB value (9.5~11.5) and amount of surfactant (2~4 wt%) as independent variables. As a result of optimization, the combination with a large HLB value gap (ES-01) showed an HLB value of 10.37 and a surfactant amount of 3.47 wt%, ESI of 97.7%, MDS of 2.20 mm, and SPAN of 1.00. The combination with a small HLB value gap (ES-02) yielded optimal conditions at a mixed surfactant HLB value of 10.26 and a surfactant amount of 3.59 wt%, ESI of 97.4%, MDS of 3.10 mm, and SPAN of 0.90. Therefore, the combination of surfactants with a small HLB value gap formed a more uniform interfacial arrangement and was more stable than combinations with a large gap. Unlike previous studies that only discussed the influence of the average HLB value of surfactants, this study experimentally demonstrates that the HLB value gap in mixed surfactants directly serves as a design factor for emulsion stability, which is a distinguishing feature of this study.
본 연구는 polyethylene glycol(PEG)-free 계면활성제인 polyglyceryl(PG)계 계면활성제를 이용하여 혼합 계면활성제의 hydrophilic-lipophilic balance(HLB) value gap이 MCT Oil-in-Water 유화액의 유화 특성과 안정성에 미치는 영향을 평가하였다. 혼합 계면활성제 HLB value(9.5~11.5)와 계면활성제의 양(2~4 wt%)을 독립변수로 설정하여 중심합성계획법(central composite design, CCD)을 수행하였다. 최적화 결과, HLB value gap이 큰 조합(ES-01)은 HLB value 10.37, 계면활성제의 양 3.47 wt%에서 ESI 97.7%, MDS 2.20 mm, SPAN 1.00으로 나타났고, HLB value gap이 작은 조합(ES-02)은 혼합 계면활성제 HLB value 10.26, 계면활성제의 양 3.59 wt%에서 ESI 97.4%, MDS 3.10 mm, SPAN 0.90로 최적 조건이 도출되었다. 따라서 HLB value gap이 작은 계면활성제 조합이 큰 조합 대비 더 균일한 계면 배열을 형성하여 안정한 것으로 확인되었다. 이는 기존 연구에서 계면활성제의 평균 HLB value의 영향만 논의된 것과 달리, 혼합 계면활성제의 HLB value gap이 유화 안정성에 직접적인 설계 인자로 작용함을 실험적으로 제시한 점에서 차별성을 갖는다.
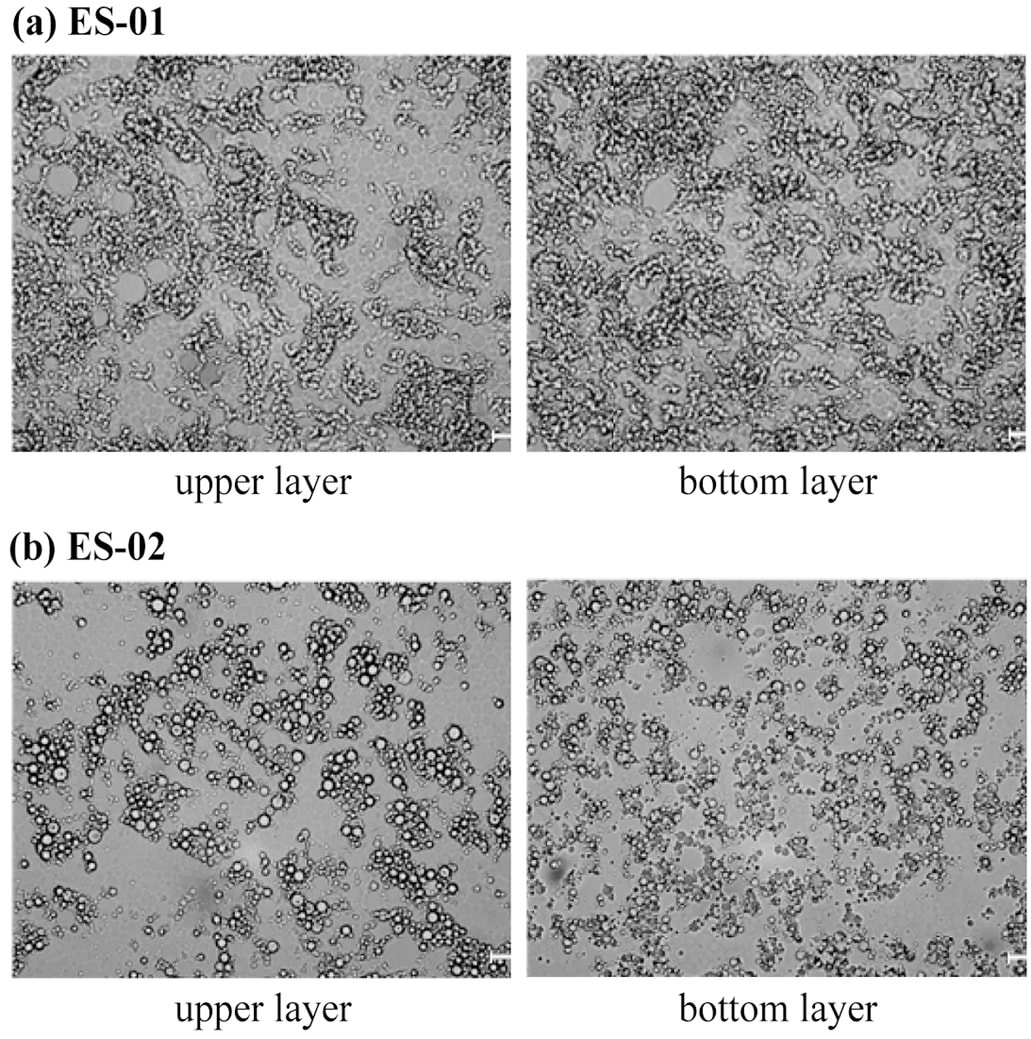
The combination of surfactants with a small hydrophilic-lipophilic balance (HLB) value gap formed a more uniform interfacial arrangement and was more stable than combinations with a large gap. Specifically, (a) ES-01 with a large HLB value gap showed non-uniform interfacial packing, whereas (b) ES-02 with a small HLB value gap exhibited a more uniform interfacial arrangement and superior emulsion stability.
Keywords: oil-in-water emulsion, polyglyceryl ester, hydrophilic-lipophilic balance value, emulsion stability, central composite design
The present research was supported by the research fund of Dankook University in 2025.
The authors declare that there is no conflict of interest.
Oil-in-water (O/W) emulsions are thermodynamically unstable and tend to separate over time owing to various physicochemical mechanisms such as flocculation, coalescence, and Ostwald ripening.1 A key factor determining the stability of these formulations is the interfacial structure between the oil and water phases. The composition and arrangement of mixed surfactant films formed at the interface directly influence droplet formation and long-term dispersion stability.2 Recently, polyglyceryl ester (PG-based) surfactants have attracted attention. Unlike polyethylene glycol (PEG) surfactants, which contain ether bonds, PG-based surfactants have structures centered on ester bonds and do not generate oxidative byproducts; they possess excellent biodegradability and low irritation, making them increasingly popular as natural, PEG-free cosmetic ingredients.3 PG-based surfactants commonly consist of a hydrophilic glycerol polyglyceryl-n (C3H5O)n backbone with hydrophobic fatty acids esterified to the backbone. The degree of hydrophilicity and hydrophobicity varies depending on the value of n and the type of fatty acid, enabling the design of a wide range of hydrophilic-lipophilic balance (HLB) values.4 Thickeners also play a secondary but important role in ensuring emulsion stability. Thickeners increase the viscosity of the aqueous phase, reduce the rate of droplet sedimentation and flocculation, and lower the frequency of droplet collisions, thereby suppressing flocculation and coalescence. In particular, sodium polyacrylate used in this study is an amphiphilic polymer thickener that adsorbs at the droplet interface to form a steric barrier, thus enhancing the physical stability of the emulsion.5 The oil used as the dispersed phase was medium-chain triglyceride (MCT) oil, which has been actively used in recent cosmetic formulations owing to its high oxidative stability and light, refreshing skin feel. Accordingly, selecting a surfactant with an appropriate HLB value is important.6 One important criterion for the selection and combination of surfactants is the HLB value, which indicates the balance between the hydrophilicity and lipophilicity of a surfactant. The HLB value ranges from 0 to 20, with higher values indicating greater hydrophilicity and lower values indicating greater lipophilicity.7 It has been reported that when the HLB value of mixed surfactants approaches the required HLB value (rHLB) of the oil, the molecular packing at the interface becomes denser, and the strength of the interfacial film increases. However, previous studies have mainly focused on matching the average HLB value of mixed surfactants to the rHLB value of the oil phase.8 To date, relatively little research has been conducted on the effects of the HLB value gap between two mixed surfactants on the actual emulsification characteristics. As a result, the selection of mixed surfactants in industry often relies on conventional combinations or empirical choices rather than scientific evidence or theoretical rationale, resulting in unclear standards for mixed surfactant selection. Therefore, this study aimed to clarify the effect of the HLB value gap between mixed surfactants on the emulsification characteristics of MCT oil-in-water emulsions and to provide a scientific criterion for selecting surfactant combinations. For this purpose, experiments were designed using central composite design–response surface methodology (CCD-RSM) based on combinations with large and small HLB value gaps. The independent variables were the HLB value of the mixed surfactants and the amount of surfactant used, while the response variables were the emulsion stability index (ESI), mean droplet size (MDS), and droplet size distribution index, to compare and analyze the emulsification characteristics of each combination.
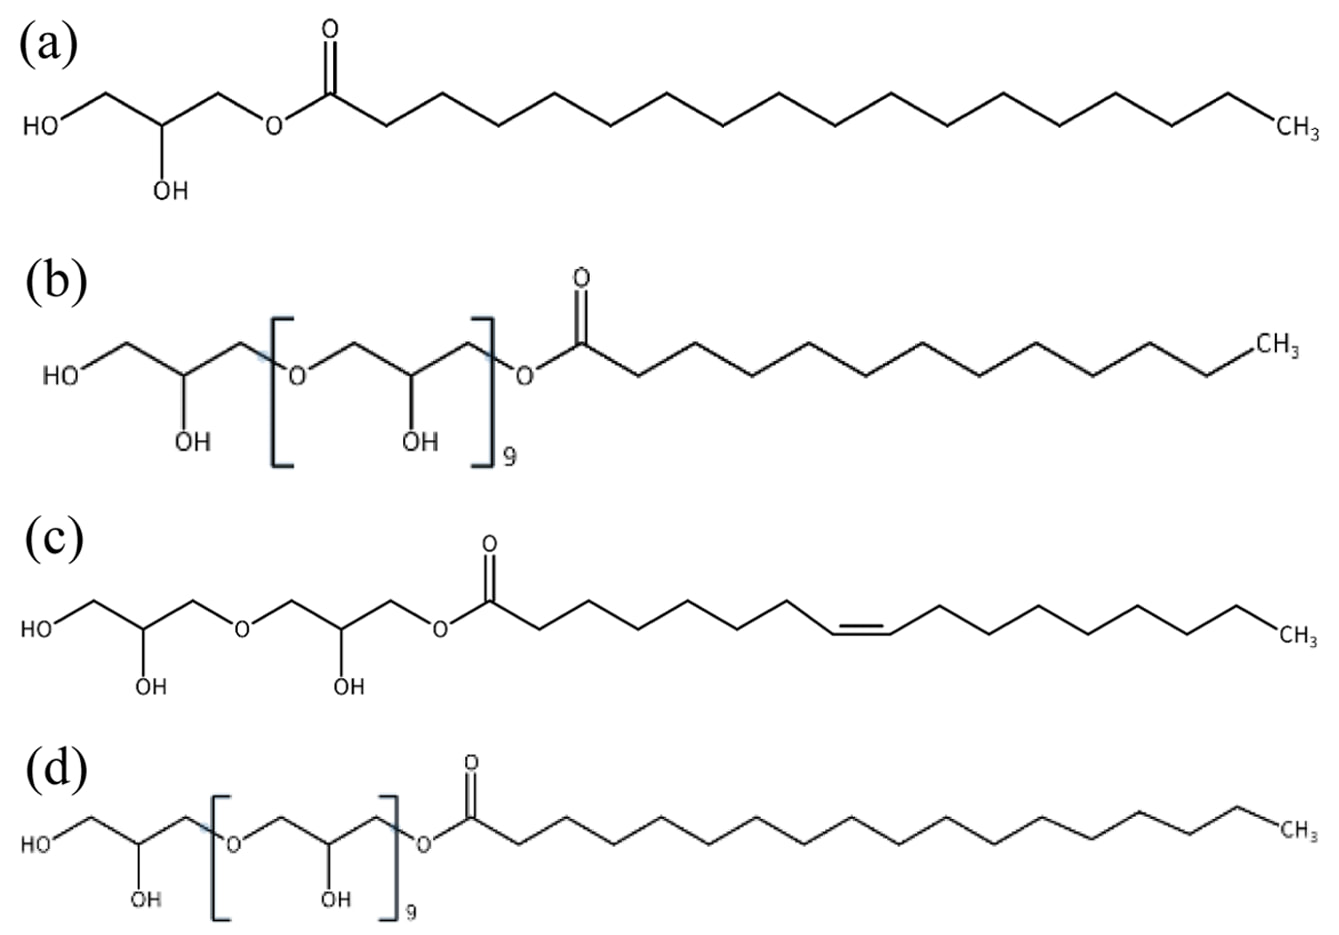
Calculation of the Mixed-surfactant HLB Value. In this study, four polyglyceryl (PG)-based surfactants supplied by Ilshin Wells were used to evaluate the change in stability of O/W emulsions as a function of the mixed-surfactant HLB value combinations. The molecular structures of the surfactants are presented in Figure 1.
Based on the HLB value gap of the mixed surfactant system, the formulation with a large gap was designated ES-01, and that with a small gap was designated ES-02. The compositions and HLB values of the two systems are listed in Table 1. According to the experimental conditions designed by CCD–RSM, the mixed-surfactant HLB value was calculated from the HLB values of the individual surfactants using Griffin’s mixing rule (Eq. (1)).9

where HLB is the HLB value of each surfactant and fi represents the mass fraction of each surfactant in the blend.
Preparation of Emulsion. The emulsion was prepared using ultrapure water and sodium polyacrylate (Cosmedia SP, Germany) as the aqueous phase, and MCT oil (KLK Oleo, Malaysia) and a PG-based surfactant (Ilshin Wells, Korea) as the oil phase. The emulsion had an O/W ratio of 1:9 (w/w), and a total mass of 200 g was prepared, with the surfactant included in the mass of the aqueous phase. The concentration of the thickener was set to 0.15 wt% based on preliminary experiments. When the concentration of the thickener was low, droplet aggregation and phase separation of the emulsion occurred easily, whereas a higher concentration allowed the emulsion to remain stably maintained for more than three days. However, because the aim of this study was to evaluate changes in physical properties up to three days after preparation, the optimal condition was to maintain stability for at least 12 h immediately after emulsification and gradually separate thereafter, leading to a thickener concentration of 0.15 wt%. The aqueous and oil phases were weighed according to their respective mass ratios and heated to 70 ℃, then emulsified at 3000 rpm for 10 min using a high-speed stirrer (Homo mixer Mark Ⅱ 2.5). The resulting emulsion was cooled to 30 ℃, stored in a 25 ℃ incubator, and used for analyses to evaluate stability.
Evaluation of Emulsion Stability. To evaluate the stability of the emulsion, each sample was transferred into a glass bottle immediately after preparation and stored in a 25 ℃ incubator for three days for comparison and analysis. In this study, the response factors of RSM were set as the ESI, MDS, and Droplet Size Distribution Index (SPAN).
The ESI is an indicator used to assess the stability of emulsions, and it was evaluated by measuring the degree of phase separation due to gravity. The total height of the emulsion and the height of the cream layer in the glass bottle were measured and calculated using Eq. (2).10

In Eq. (2), HE represents the total height of the emulsion and HC represents the height of the creaming layer. An ESI value close to 100% indicates better emulsion stability. The mean droplet size (MDS) and droplet size distribution index of the emulsion were measured using a laser diffraction particle size analyzer (LA-960V2, Horiba). Ultrapure water with a refractive index (RI) of 1.333 was used as the dispersant, and the upper phase of the separated sample was used. To minimize errors during sample dispersion, the transmittance at red light (λ=655 nm) and blue light (λ=405 nm) was adjusted within the range of 85–90%. Furthermore, to ensure the reliability of droplet size and distribution analyses, each condition was measured three times according to the ISO 13320 standard, and only samples with a coefficient of variation (COV) of 6% or less for D50, and 10% or less for D10 and D90, were used for analysis.11

In Eq. (3), wc is based on Stokes’s law and indicates the creaming rate of the emulsion. It is proportional to the square of the droplet diameter (d), increases with the density difference between the dispersed (ρd) and continuous (ρc) phases and gravitational acceleration (g), and decreases with the viscosity of the continuous phase (η). In particular, this relationship indicates that as the MDS increases, the creaming rate increases nonlinearly, providing theoretical evidence that emulsion stability decreases. In other words, as the MDS decreases, the creaming rate decreases, resulting in less droplet separation due to gravity and improved physical stability of the emulsion .12 The droplet size distribution index was calculated using SPAN, according to Eq. (4).

In Eq. (4), D10, D50, and D90represent the droplet diameters (mm) corresponding 10%, 50%, and 90% of the cumulative volume of the droplet size distribution, respectively. A lower SPAN indicates a narrower distribution width, implying that the droplets are more uniformly dispersed within the emulsion.13
Physicochemical Characterization of Emulsions Prepared at the Optimal Conditions. Emulsions prepared under the optimal conditions predicted by CCD–RSM were characterized immediately after preparation and on day 7. When phase separation occurred, the upper and lower layers were collected and analyzed separately.
The droplet morphology and dispersion characteristics were observed using an optical microscope (KB-320, Optinity) at 400× magnification under consistent conditions. Microscopic images were used to visually assess the droplet shape, dispersion uniformity, and presence of flocculation or coalescence.
The zeta potential was measured using a Zetasizer (Zen 3600, Malvern) to evaluate the electrostatic stability. Each sample (10 µL) was diluted in 20 mL of ultrapure water (continuous phase) and loaded into a DTS1070 cell (Malvern). Measurements were performed in triplicate under identical conditions, and the mean values were used for analysis.
The viscoelastic properties of the emulsions were evaluated using a rheometer (MCR92, Anton Paar) equipped with a double-gap geometry (DG26.7, Anton Paar). Measurements were conducted for the upper layer of the samples stored for 7 days. After determining the linear viscoelastic region (LVE range) by an amplitude sweep, a frequency sweep was performed within the LVE range to obtain the storage modulus (G′) and loss modulus (G″). Because G′ reflects elastic behavior and G″ reflects viscous behavior, their relative magnitudes provide important indicators of the physical stability and network formation in emulsions.14
|
Figure 1 Chemical structures of the individual surfactants used in the formulation of ES-01 and ES-02: (a) glyceryl monostearate (used in ES-01); (b) polyglyceryl-10 myristate (used in ES-01); (c) polyglyceryl-2 oleate (used in ES-02); (d) polyglyceryl-10 stearate (used in ES-02). |
|
Table 1 Composition and HLB value of Surfactant Combinations Used in This Study |

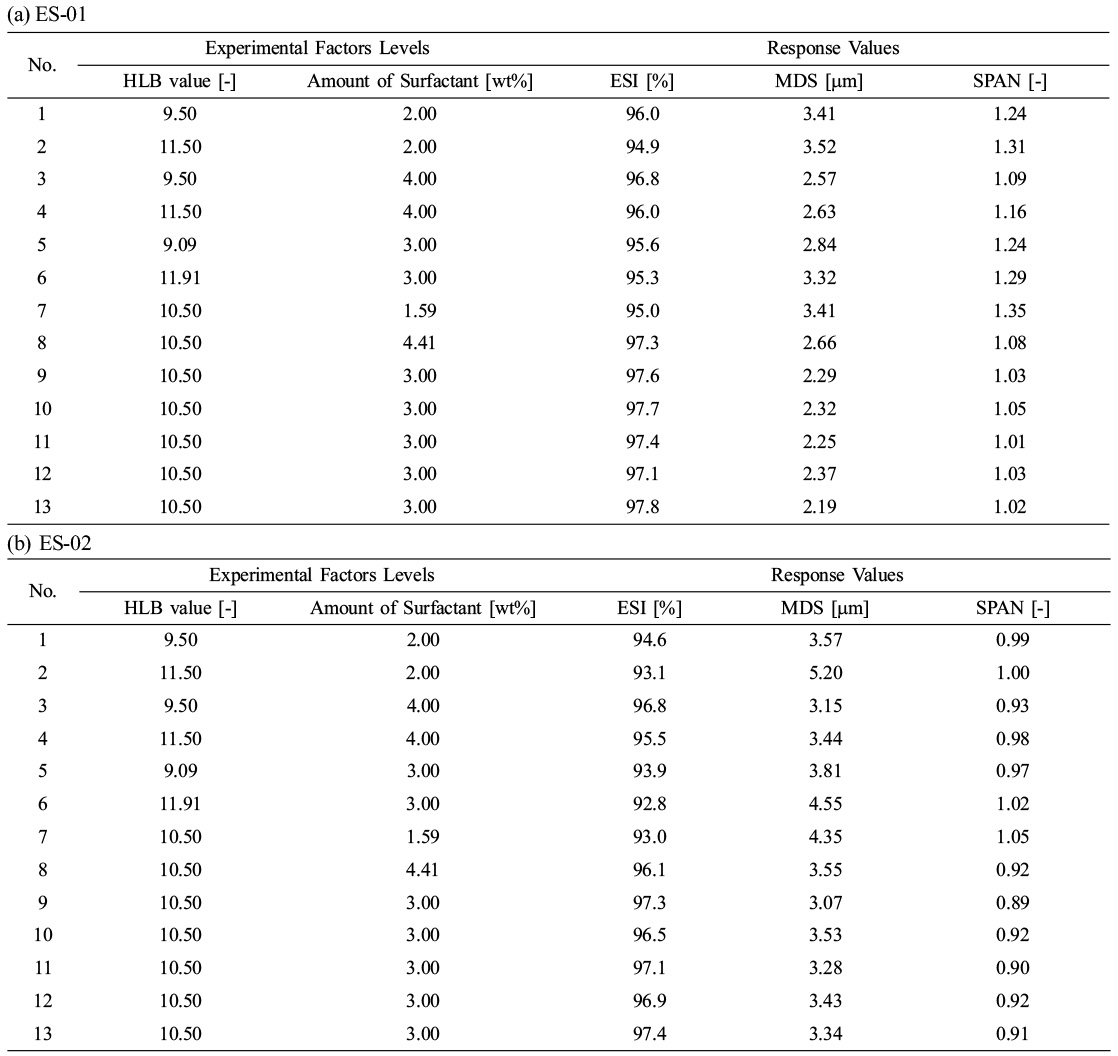
CCD–RSM Design. Based on preliminary experiments, the independent variables were set to the mixed-surfactant HLB value (9.5~11.5) and total amount of surfactant (2~4 wt%), while the responses were the ESI, MDS, and SPAN. CCD–RSM was applied to generate 13 experimental runs for each system, and the experimental design and response data are presented in Table 2(a) and (b).
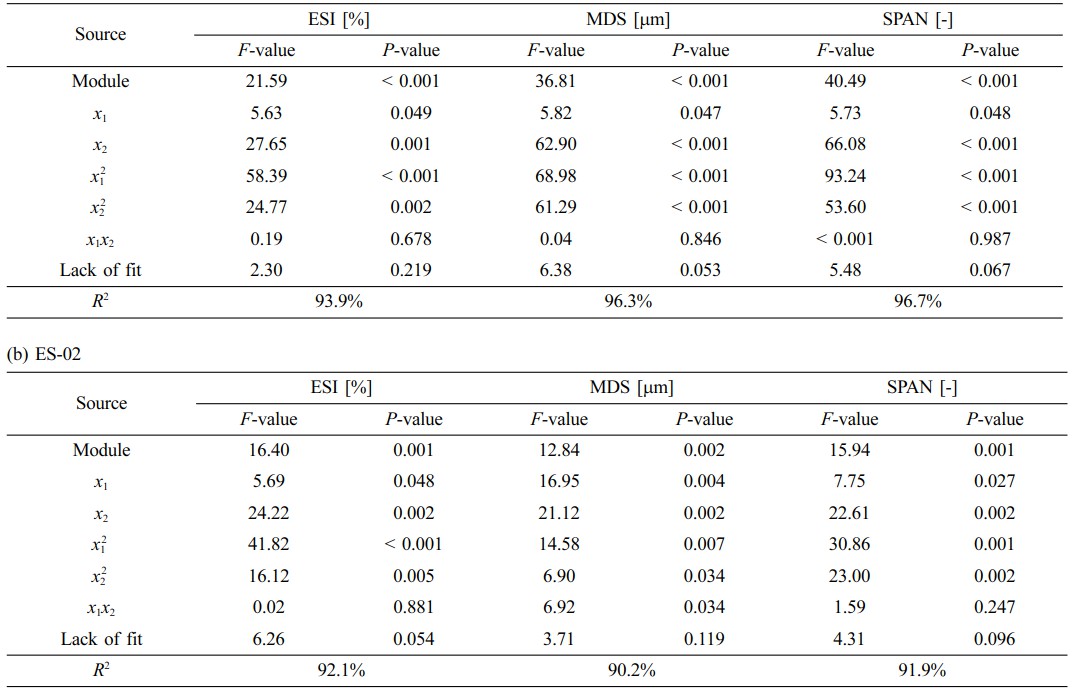
To assess the statistical significance of the models, analysis of variance (ANOVA) was performed, and the results are summarized in Table 3(a) and (b). The F-value, P-value, and coefficient of determination (R2) were used to evaluate statistical significance and model reliability. The F-value and P-value indicate the influence and significance of the independent variables; a P-value below 0.05 is generally considered statistically significant. The R2 value describes the goodness-of-fit of the regression model, and values closer to 100% indicate higher model adequacy and reliability.15
In Table 3, x1 and x2 denote the independent variables, namely the mixed-surfactant HLB value and amount of surfactant, respectively. ANOVA results confirmed that, for both systems, the regression models were statistically significant for all responses (P-values below 0.05), and the R2 values exceeded 90%, indicating high reliability. In addition, the lack-of-fit P-values were greater than 0.05, supporting model adequacy. For both systems, the linear effect of x2 was stronger than that of x1, as reflected by higher F-values, indicating that the amount of surfactant had a greater linear contribution. However, among nonlinear terms, x12showed a larger effect than x22,suggesting that the mixed-surfactant HLB value exerted a stronger influence on the response behavior in the nonlinear region.
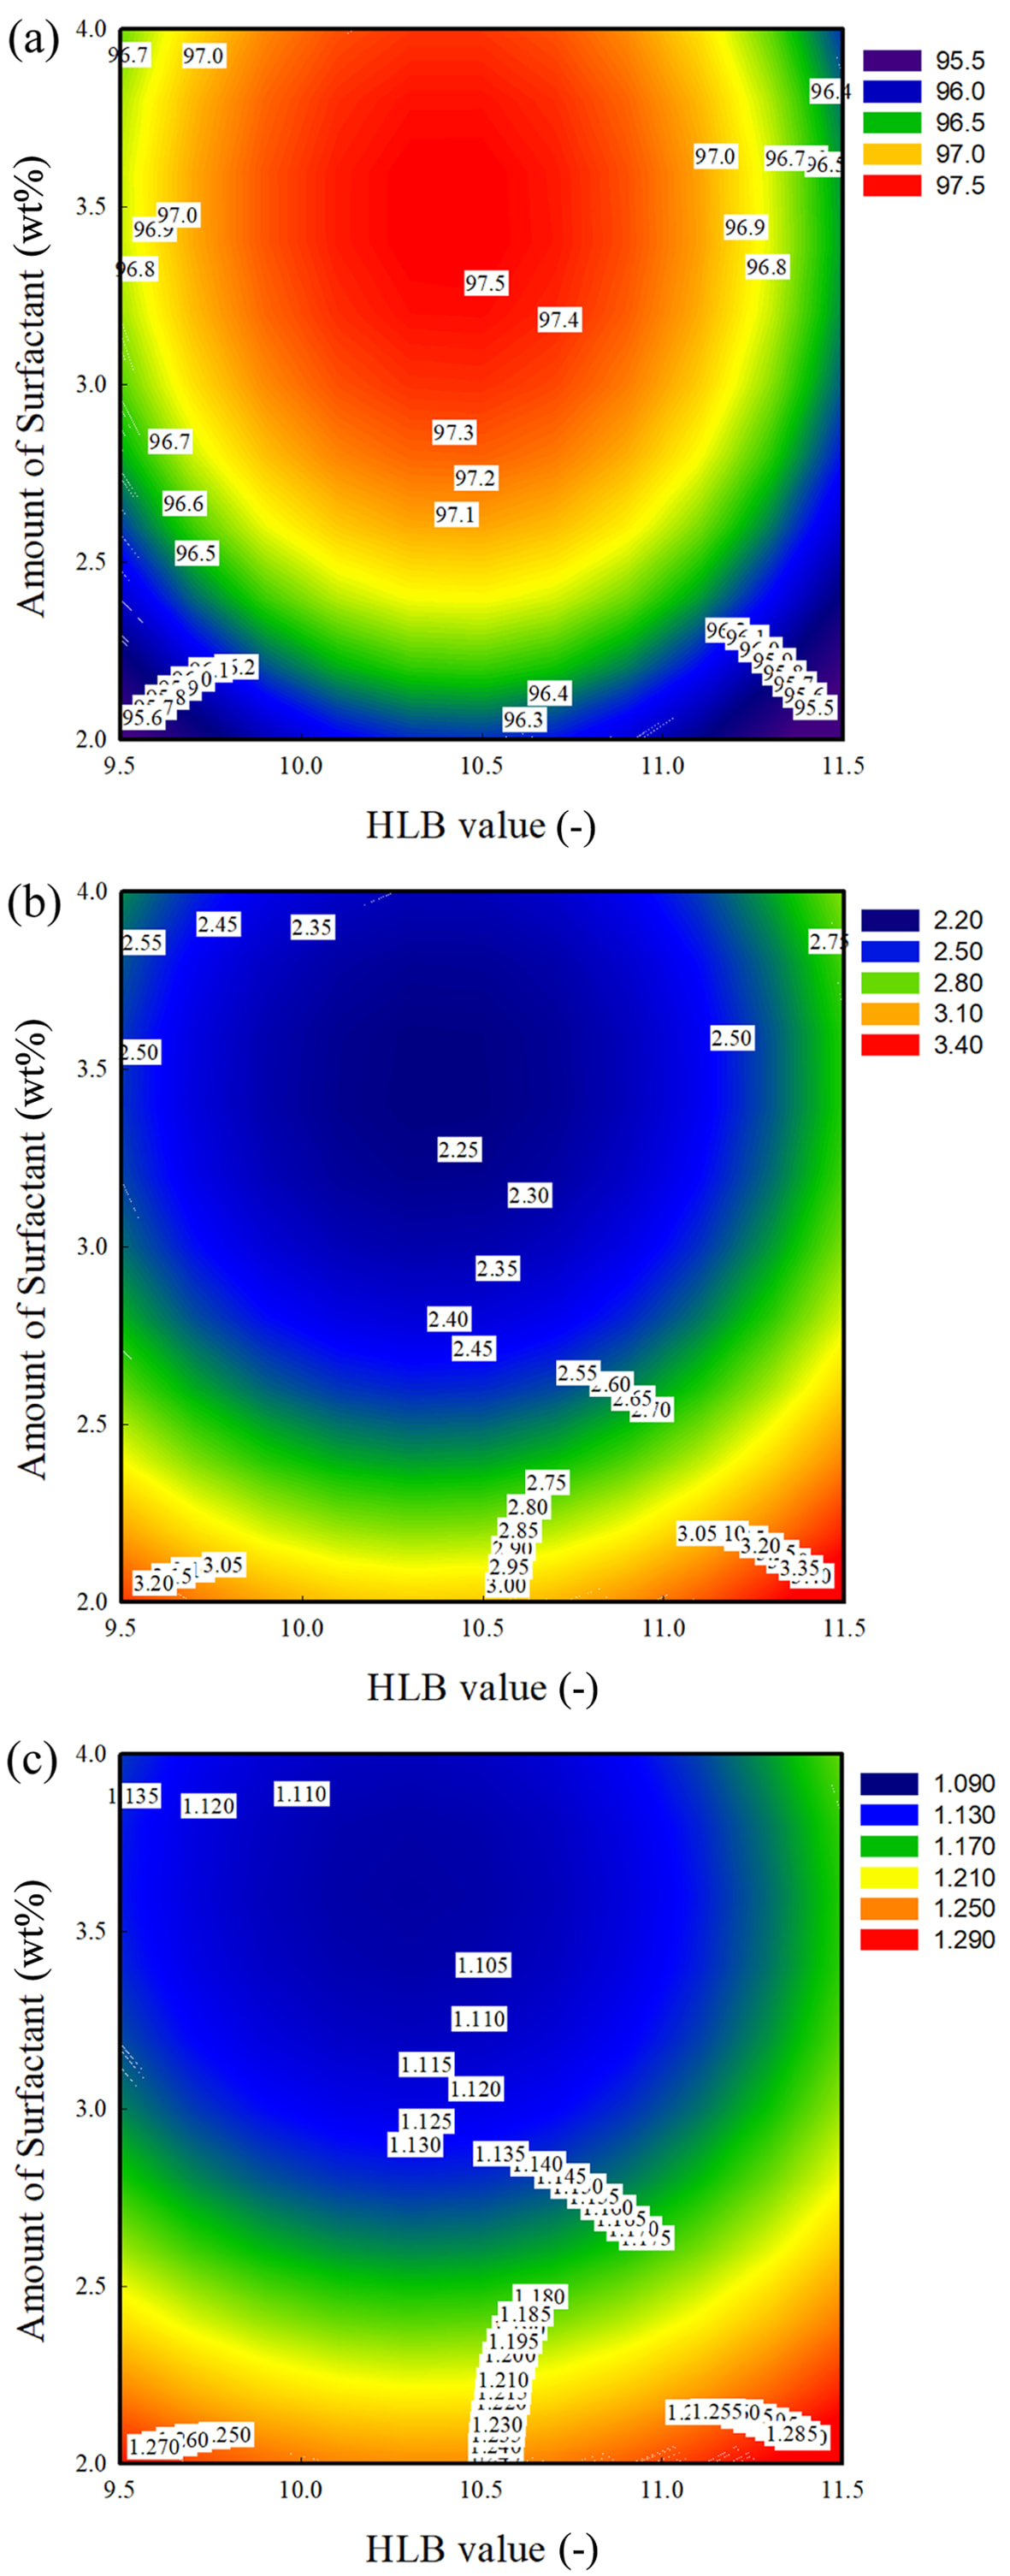
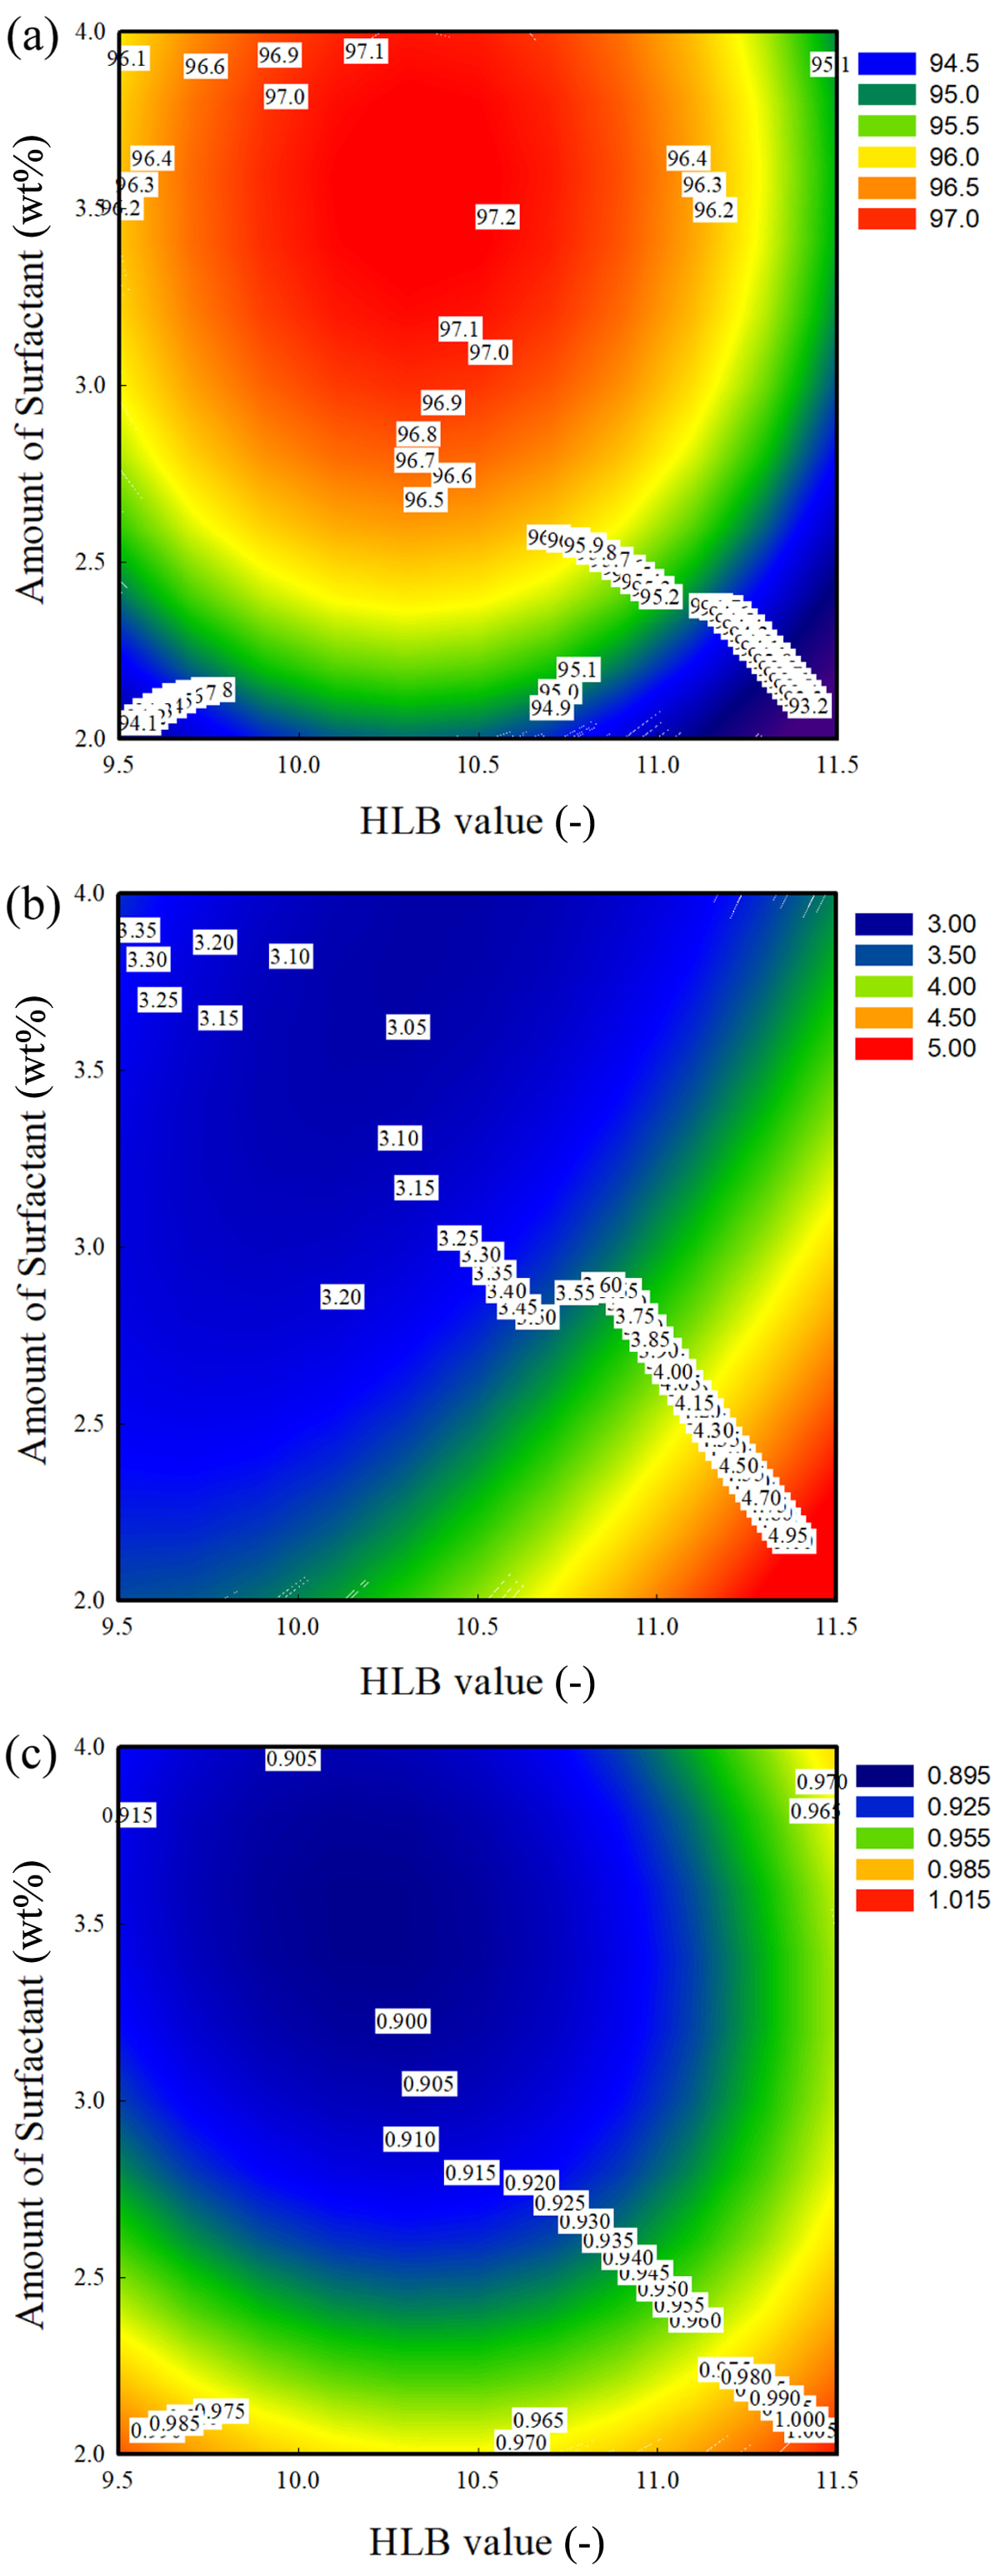
Effect of Mixed-surfactant HLB Value. Figure 2 and Figure 3 present contour plots constructed from the regression equations, illustrating the changes in the responses as functions of the independent variables, namely the mixed-surfactant HLB value and amount of surfactant, for ES-01 and ES-02, respectively.
The regression models describing the effects of the mixed-surfactant HLB value on ESI for ES-01 and ES-02 are given as follows.
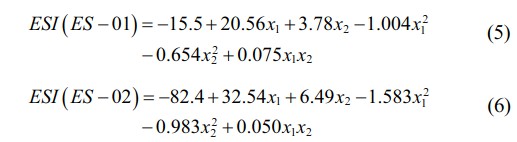
As shown in Figure 2(a) and Figure 3(a), the quadratic coefficients of x12in the regression equations are negative, indicating that ESI initially increased with increasing HLB value, followed by a slight decrease beyond an optimal HLB value. This behavior can be attributed to insufficient stabilization of the aqueous phase at low HLB values, which may promote droplet flocculation and formation of an unstable interfacial film. At the optimal HLB value, surfactant molecules are expected to pack efficiently at the interface, minimizing interfacial tension and maximizing stability. In contrast, at higher HLB values, excessive hydrophilicity may lead to increased dissolution/dispersion of surfactant molecules into the aqueous phase rather than remaining at the interface, thereby reducing the stabilization efficiency.16
The regression equations for MDS were obtained as follows:
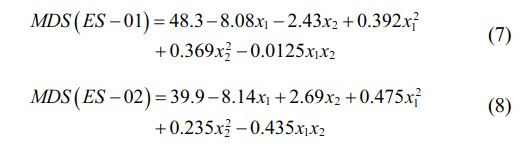
Because the quadratic coefficients in the MDS models are positive, MDS decreased at first with increasing HLB value and then increased again after the optimum, which is consistent with the trends observed in Figure 2(b) and Figure 3(b). At low HLB values, interfacial stabilization on the oil side may be relatively sufficient, whereas stabilization of the aqueous continuous phase can be inadequate, resulting in the formation of larger droplets. At the optimal HLB value, more balanced interfacial packing is expected, leading to minimization of droplet size.17 At higher HLB values, excessive hydrophilicity may reduce effective adsorption/interaction at the oil–water interface, resulting in an increase in MDS. Notably, at the same amount of surfactant, higher mixed-surfactant HLB values tended to yield larger MDS than lower HLB values. This trend may be related to an increased fraction of more hydrophilic PG10-based surfactants (PG10-M and PG10-S) at higher HLB values, which could increase the effective molecular weight and interfacial cross-sectional area, thereby increasing the preferred radius of curvature and leading to larger droplets. In addition, enhanced hydrophilicity of the dispersed phase may facilitate partial migration of surfactant-associated species into the continuous phase and subsequent droplet association, which may contribute to droplet growth or aggregation.8
The regression equations for SPAN were obtained as follows:
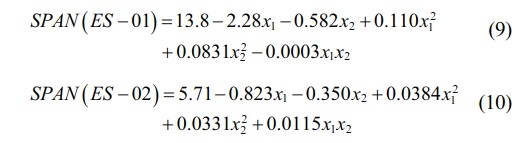
As shown in Figure 2(c) and Figure 3(c), SPAN decreased as the mixed-surfactant HLB value increased. This indicates that, at low HLB values, the coexistence of relatively large and small droplets resulted in a broad size distribution and thus a higher SPAN. At the optimal HLB value, a better balance in affinity between the oil and aqueous phases likely improved interfacial packing and droplet uniformity, leading to the minimum SPAN. Beyond the optimal HLB range, SPAN increased again. This trend is consistent with previous findings that denser surfactant packing at the interface promotes a more uniform droplet size distribution.18
Overall, the mixed-surfactant HLB value was confirmed to be a key factor affecting ESI, MDS, and SPAN. At low HLB values, insufficient stabilization of the aqueous phase likely promoted droplet aggregation, whereas at high HLB values, excessive hydrophilicity may have caused surfactants to partition preferentially into the aqueous phase rather than remain at the interface, reducing stabilization efficiency. Therefore, interfacial stabilization is maximized at an optimal mixed-surfactant HLB value, highlighting its critical importance in emulsion system design.
Effect of Amount of Surfactant. In Figure 2(a) and Figure 3(a), both systems showed a clear increase in ESI as amount of surfactant increased, followed by a slight decrease beyond the optimal concentration. At low surfactant levels, insufficient adsorption at the interface likely resulted in poor stability; as the amount increased, interfacial coverage approached saturation and droplet–droplet association was suppressed, improving stability.19 At relatively low amounts, surfactant molecules tend to remain as monomers in solution, where the entropy of mixing dominates. However, once the amount of surfactant exceeds the critical micelle concentration (CMC), surfactant molecules spontaneously self-associate to form small colloidal aggregates referred to as free micelles. Under such conditions, the interface may already be saturated, and additional surfactant is less likely to further enhance emulsion stability.20
In Figure 2(b) and Figure 3(b), MDS gradually decreased with increasing amount of surfactant. When surfactant was insufficient, interfacial tension reduction at the oil–water boundary was limited, leading to the formation of larger droplets. In contrast, when surfactant was excessive, the formation of free micelles likely reduced the fraction of surfactant available for interfacial adsorption, thereby limiting further decreases in droplet size. At the optimal amount of surfactant, efficient interfacial organization may maintain a balance between attractive van der Waals interactions and repulsive forces, resulting in smaller and more stable droplets.21
Similarly, SPAN in Figure 2(c) and Figure 3(c) was relatively high at a low amount of surfactant, but reached a minimum near the optimal condition. Beyond this point, SPAN no longer decreased and showed only minor changes. This can be interpreted as follows: when surfactant is insufficient, interfacial tension remains relatively high and droplet size uniformity decreases; additionally, Ostwald ripening may broaden the size distribution as smaller droplets diminish and larger droplets grow. In contrast, at an excessive amount of surfactant, free micelle formation may increase inefficiencies in the interfacial surfactant distribution, limiting further improvements in droplet-size uniformity.22-23
Taken together, an optimal amount of surfactant resulted in balanced improvements across all responses, suggesting efficient interfacial action of the surfactants. These results indicate that controlling the amount of surfactant is an essential consideration in emulsion formulation design.
Comparison of Emulsification Characteristics of Emulsions Prepared at the Optimal Conditions. In this study, optimal emulsification conditions were determined for two mixed-surfactant systems with different HLB value gaps, and the physicochemical properties of ES-01 and ES-02 emulsions prepared at their respective optima were comparatively evaluated. From the multi-response optimization, the optimum for ES-01 was obtained at a mixed-surfactant HLB value of 10.37 and amount of surfactant of 3.47 wt%, yielding ESI of 97.7%, MDS of 2.20 mm, and SPAN of 1.00. For ES-02, the optimum was derived at a mixed-surfactant HLB value of 10.26 and amount of surfactant of 3.59 wt%, with ESI of 97.4%, MDS of 3.10 mm, and SPAN of 0.90.
When comparing the predicted responses with experimental validation, ES-01 showed ESI of 97.3%, MDS of 2.41 mm, and SPAN of 1.03, with an average error within ±4.05%. For ES-02, the experimental results were ESI of 96.9%, MDS of 3.25 mm, and SPAN of 0.90, with an average error within ±3.67%. These results suggest that, in PG-based surfactant systems for MCT O/W emulsions, an appropriate combination of the mixed-surfactant HLB value and amount of surfactant plays a critical role in interfacial stabilization.
The emulsions prepared at the optimal conditions were further characterized during storage for 7 days, and the upper and bottom layers were separately collected for analysis. Droplet size distribution and microstructure were evaluated using a particle size analyzer and optical microscopy, while electrostatic stability and viscoelastic properties were assessed using a Zetasizer and Rheometer, respectively.
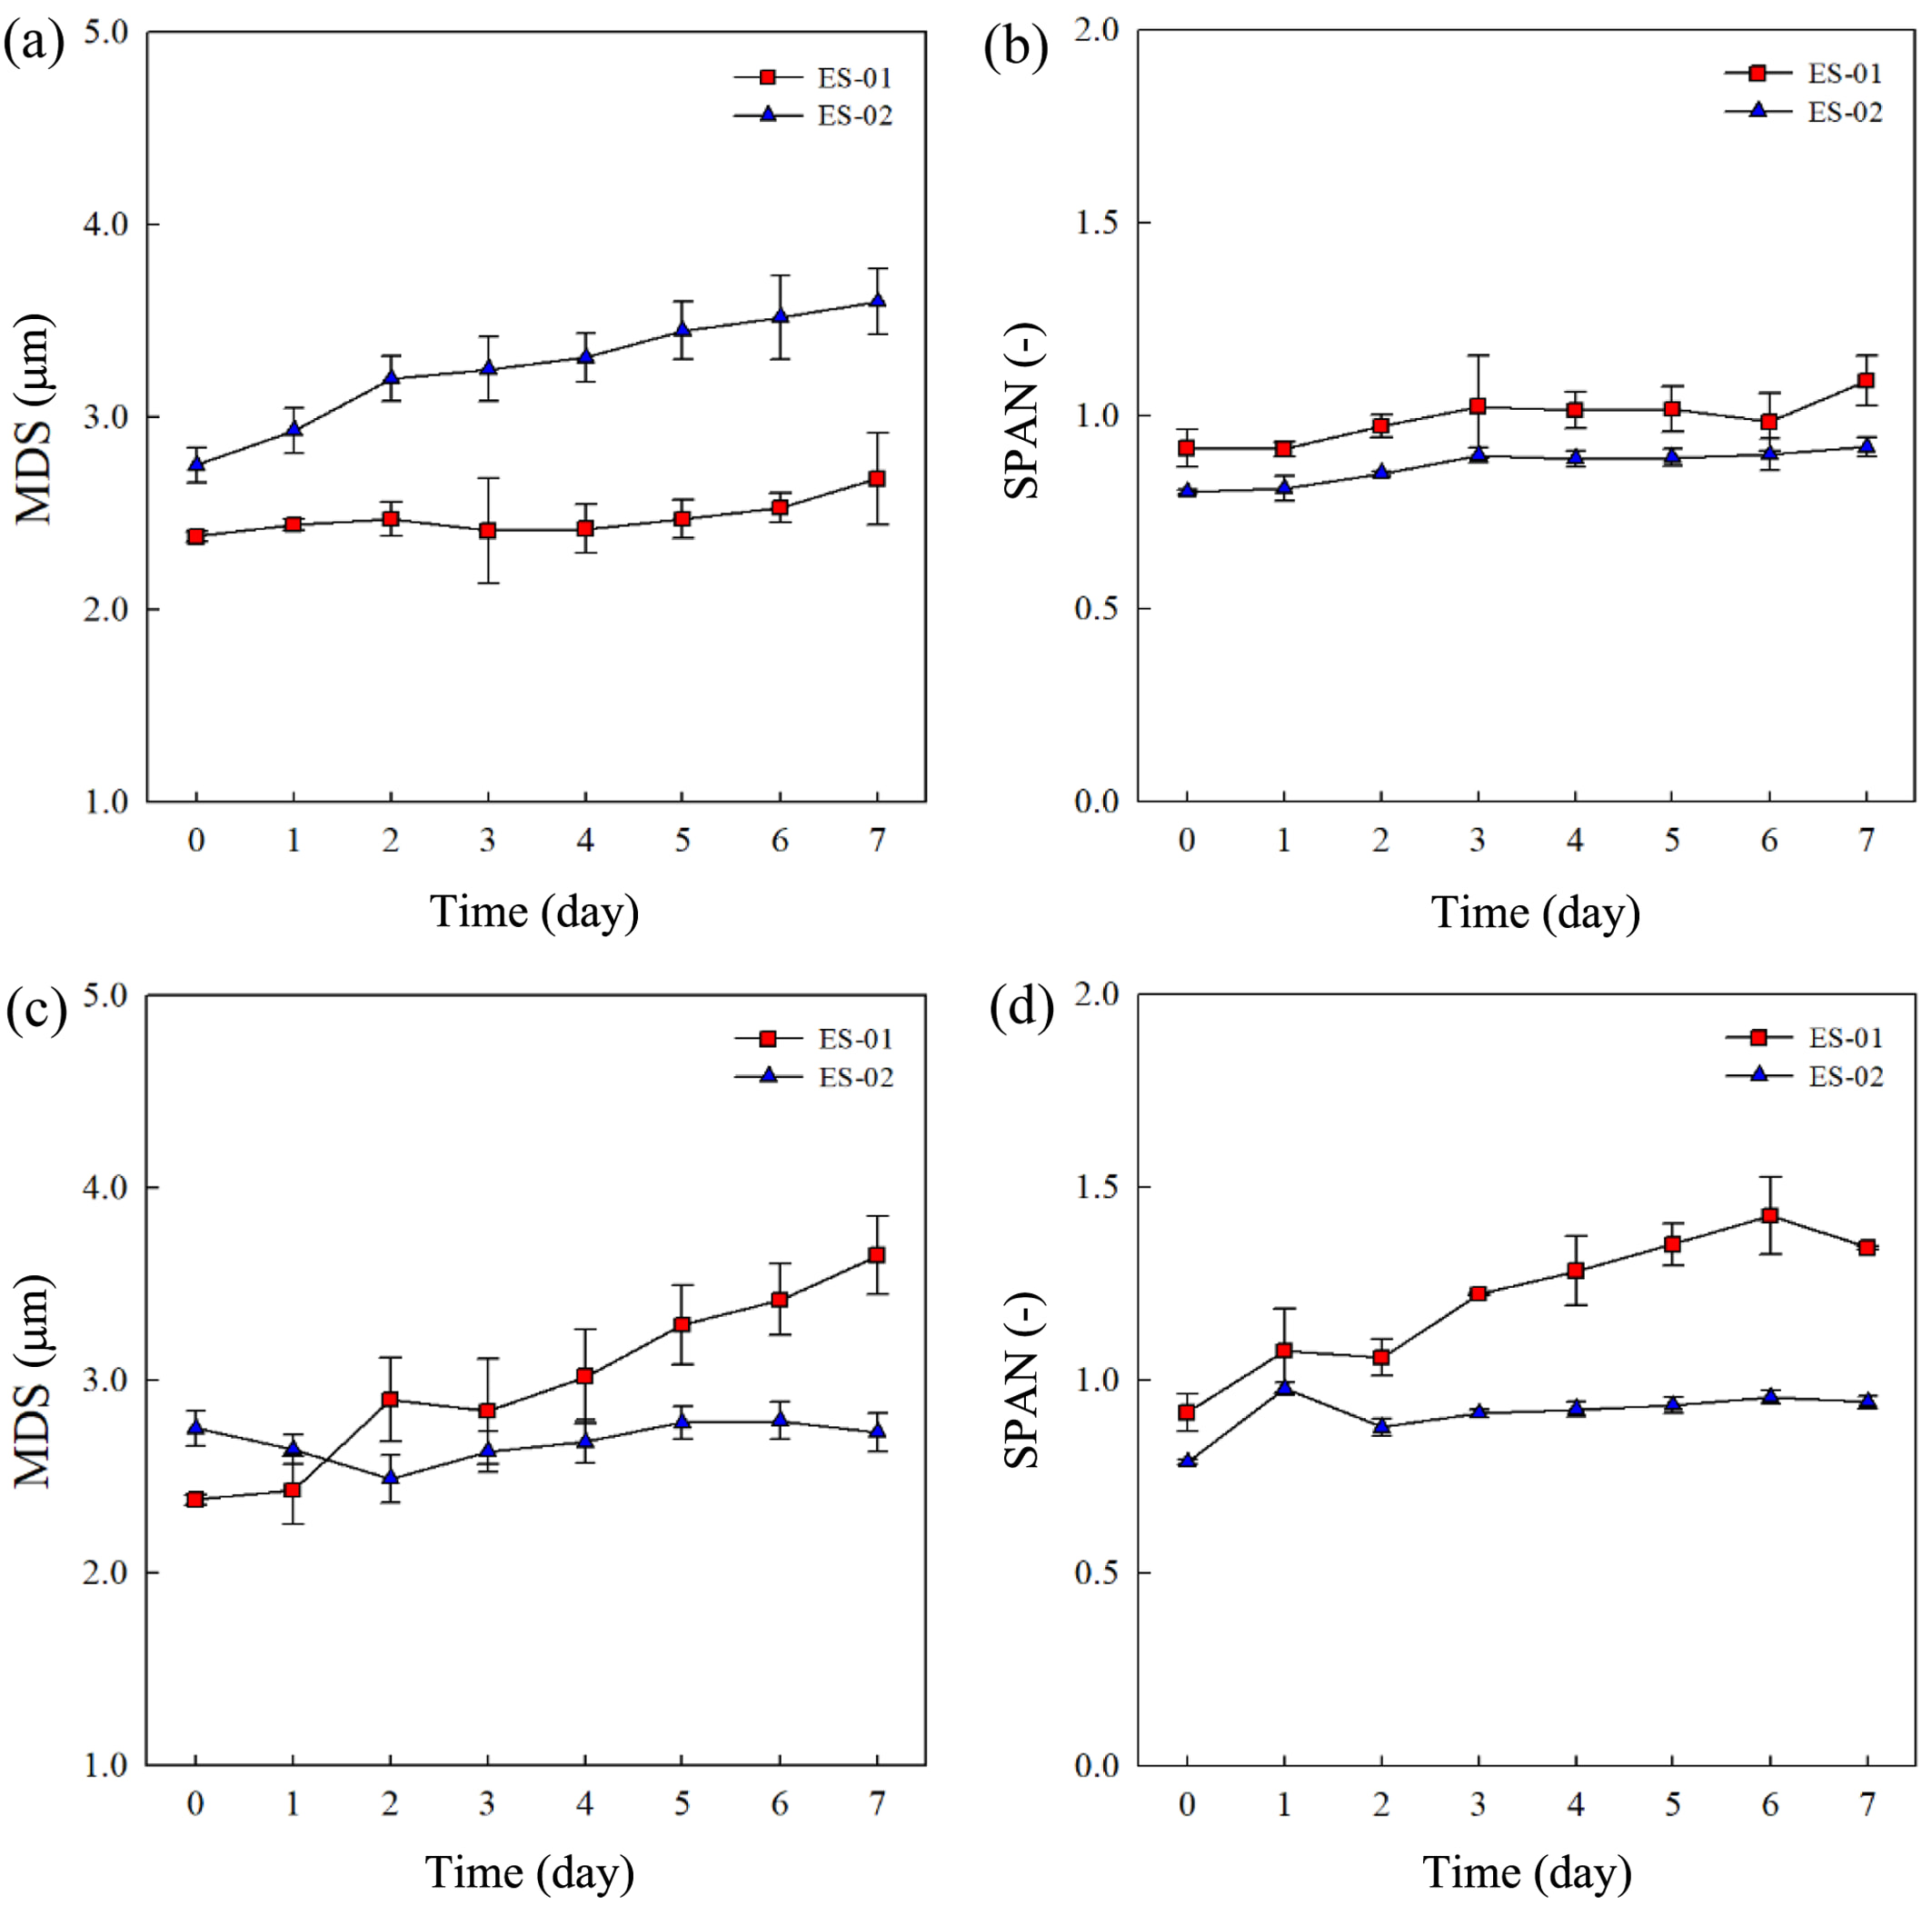
First, using a particle size analyzer, the MDS and SPAN of ES-01 and ES-02 were analyzed, which revealed different particle size characteristics, as shown in Figure 4. In Figure 4, both combinations displayed a gradual increase in the MDS and SPAN of both the upper and lower layers as the storage period progressed. This phenomenon indicates the occurrence of droplet aggregation and coalescence at the interface, reflecting the characteristics of a thermodynamically unstable emulsion system. The interfacial free energy of the emulsion system can be expressed as shown in Eq. (11).

Here, dGs represents the change in interfacial free energy, -SsdT is the entropy term, Adg is the interfacial term due to interfacial tension, and Snidmi indicates the composition term. In other words, the free energy of the emulsion depends directly on the interfacial energy and the surface area of the droplets; thus, to minimize the free energy, the emulsion system tends to stabilize itself by minimizing the surface area of the droplets through aggregation and coalescence. Therefore, it can be interpreted that MDS and SPAN gradually increase as storage time elapses.24
In the upper layer of Figure 4(a) and Figure 4(b), ES-01 had a relatively small MDS but displayed a large SPAN, indicating a high polydispersity, whereas ES-02 showed a somewhat higher MDS but a lower SPAN, demonstrating a monodisperse distribution. This suggests that in ES-01, which has a large HLB value gap, the surfactant molecules are unevenly arranged at the interface, causing both large and small droplets to coexist. In contrast, ES-02, with a small HLB value gap, achieved an optimized ratio of hydrophilic and hydrophobic groups at the interface, resulting in the formation of monodisperse droplets. Longer chain lengths in PG-based surfactants result in better saturation on the droplet surface but yield a relatively larger MDS. Shorter chains, on account of smaller molecular weight and size, allow for faster adsorption kinetics and less steric hindrance, leading to the formation of droplets with greater curvature and thus a relatively smaller MDS.25 Moreover, the higher the degree of glycerol polymerization in PG-based surfactants, the larger the hydrophilic head, forming a stronger steric barrier and allowing for faster and more uniform adsorption to the interface, making it more stable.26 Therefore, ES-01, composed of shorter chains (PG1-S and PG10-M) compared to ES-02 (PG2-O and PG10-S), had a relatively lower MDS, but because of its lower glycerol polymerization degree, it was less stable and showed a relatively higher SPAN.
Notably, in the lower layer of Figure 4(c) and Figure 4(d), the MDS increased rapidly from 2.38 mm initially to 3.65 mm after seven days of storage, and the SPAN showed a sharp rise from 0.92 to 1.34. This indicates that structural instability of the interfacial film due to the large HLB value gap accelerated polydispersity by promoting droplet coalescence, meaning aggregation and coalescence continued steadily over time. Meanwhile, ES-02, with relatively longer chain lengths and a higher degree of glycerol polymerization, yielded larger but more stable and uniform droplets. This is believed to occur because small-headed PG2-O fits between large-headed PG10-S, changing the optimal curvature of the interface, thereby achieving higher surface tension and lower interfacial tension. This is consistent with previous studies that found using surfactants with an appropriate hydrophilic-lipophilic volume ratio reinforces the interfacial layer, preventing droplet fusion and resulting in a stable emulsion.27
In particular, in contrast to ES-01, ES-02 showed that the MDS in the upper layer increased rapidly from 2.75 mm to 3.32 mm within the first three days, then rose slowly to 3.72 mm, and both layers maintained a relatively stable SPAN. This suggests that, with surfactants of similar HLB values, droplets concentrated in the upper layer due to creaming initially underwent collision and coalescence but quickly restabilized as the interfacial film rearranged.
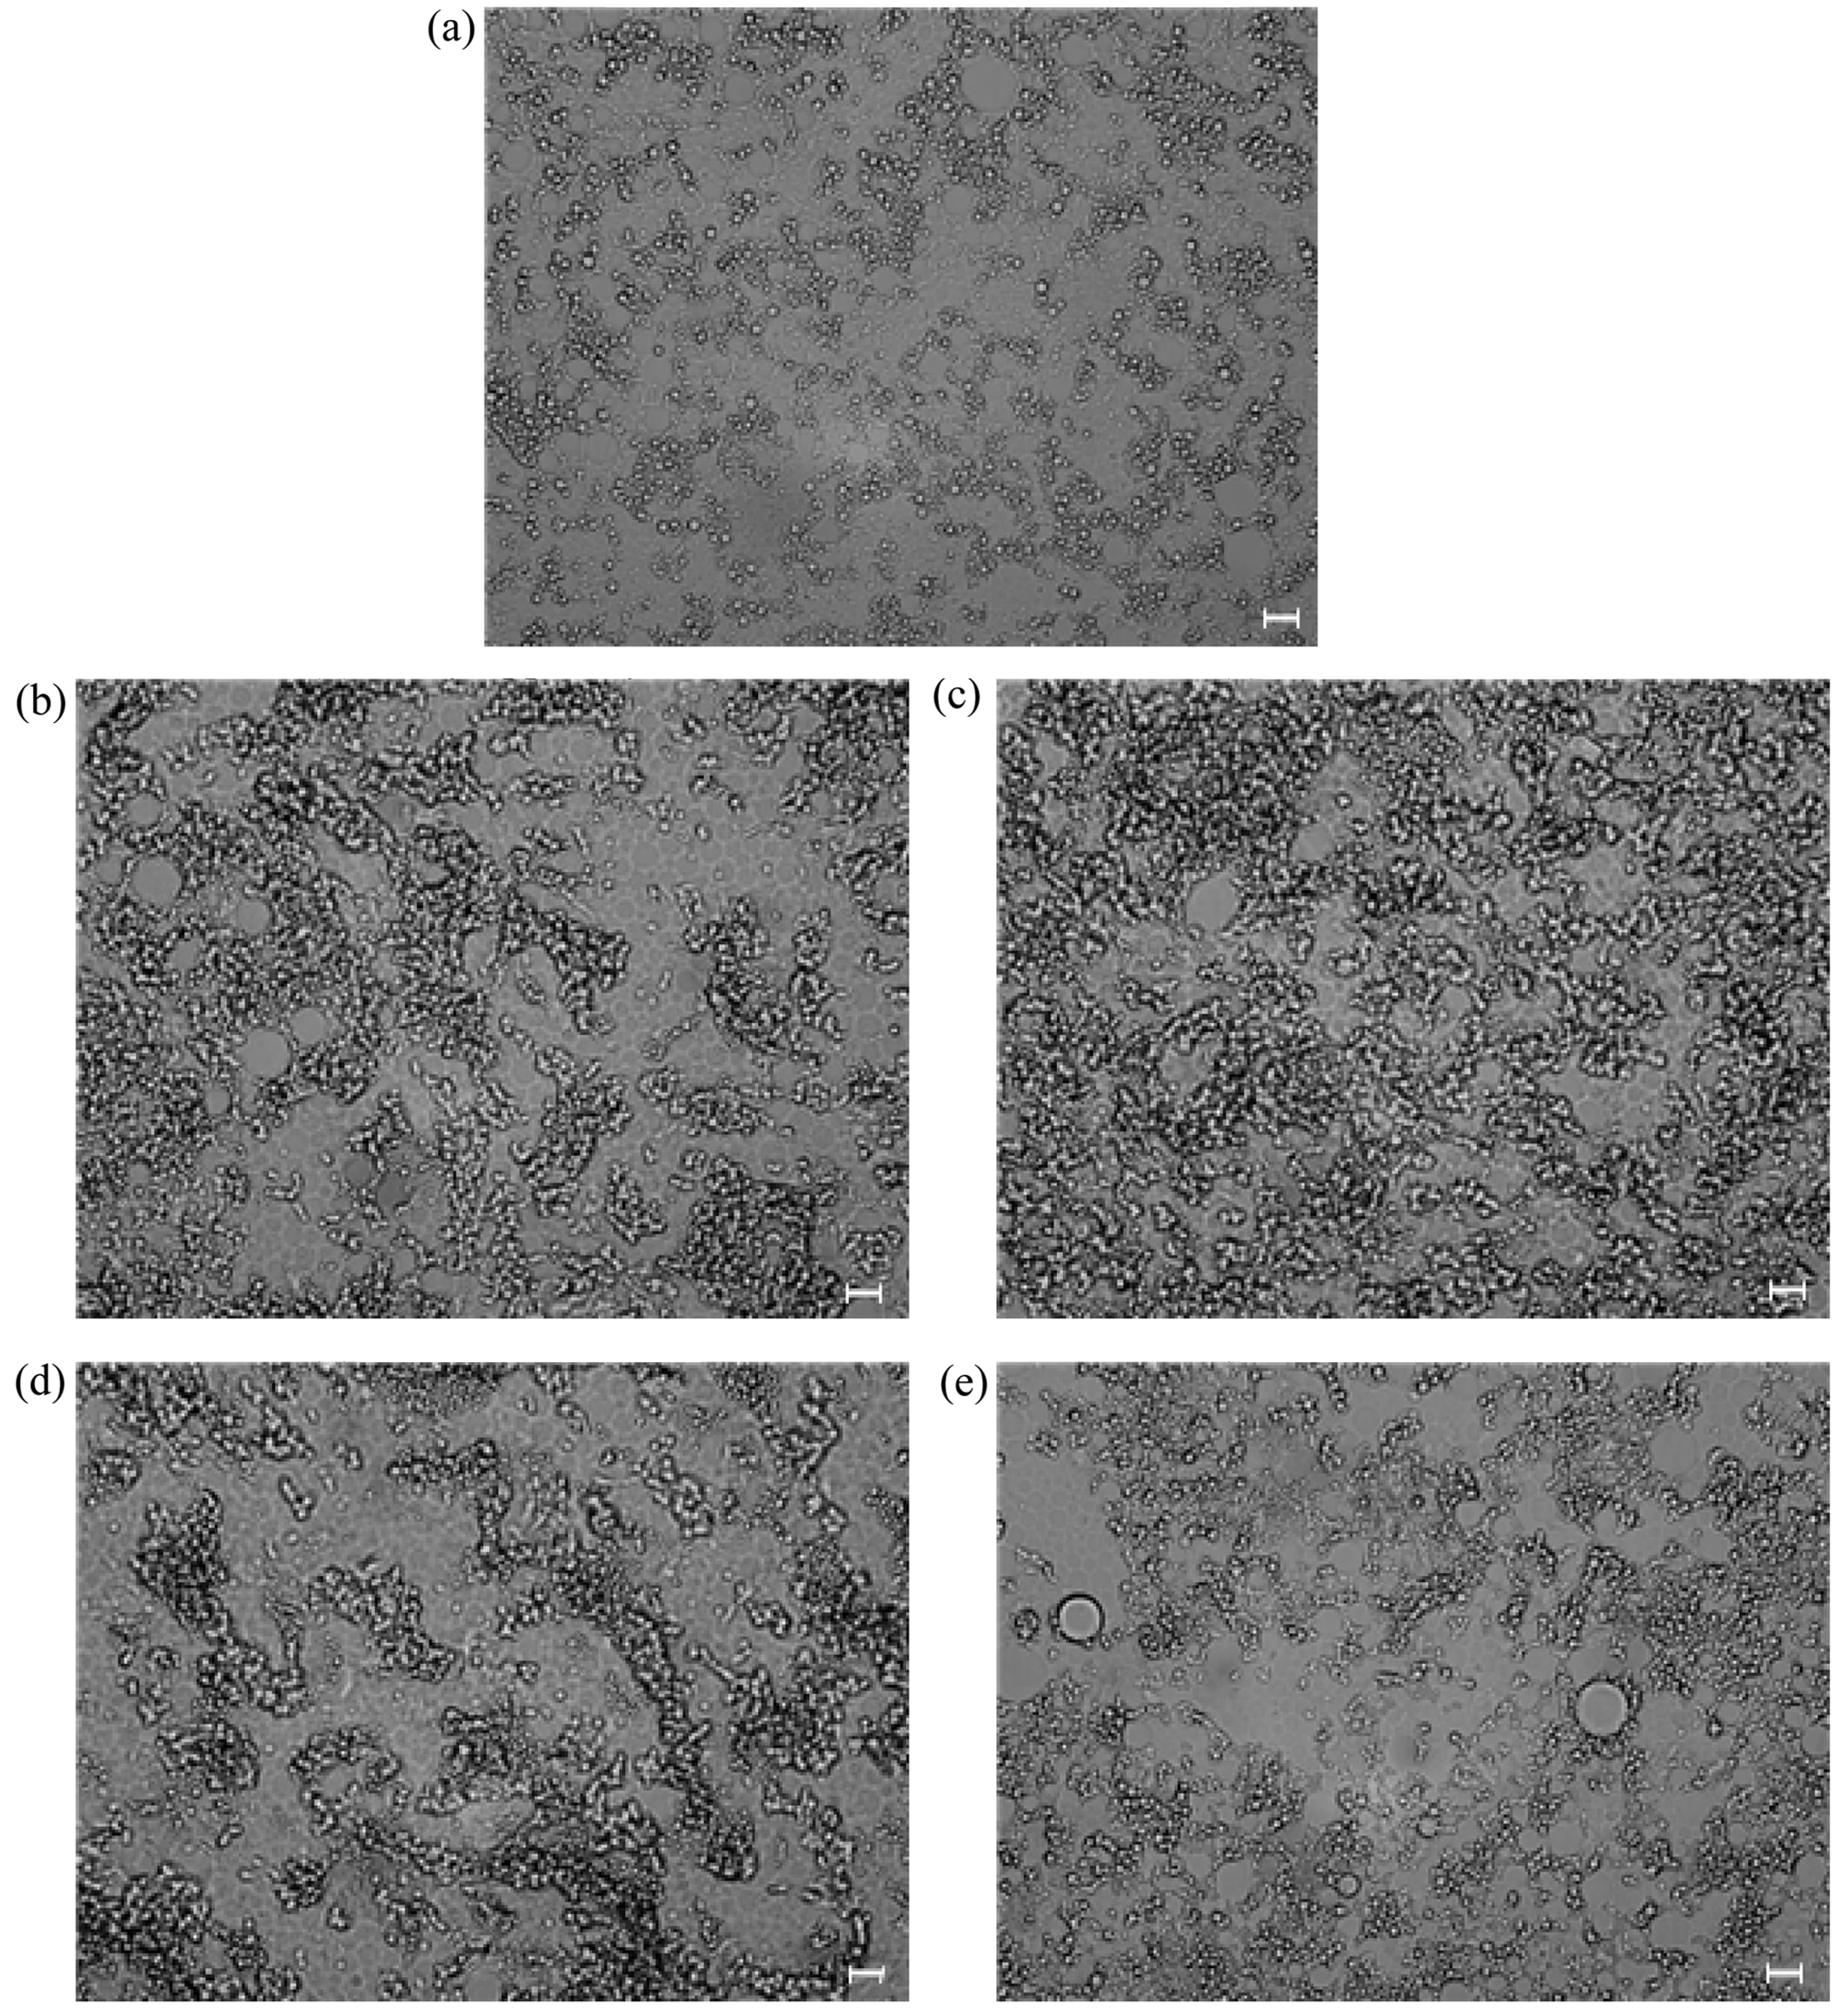
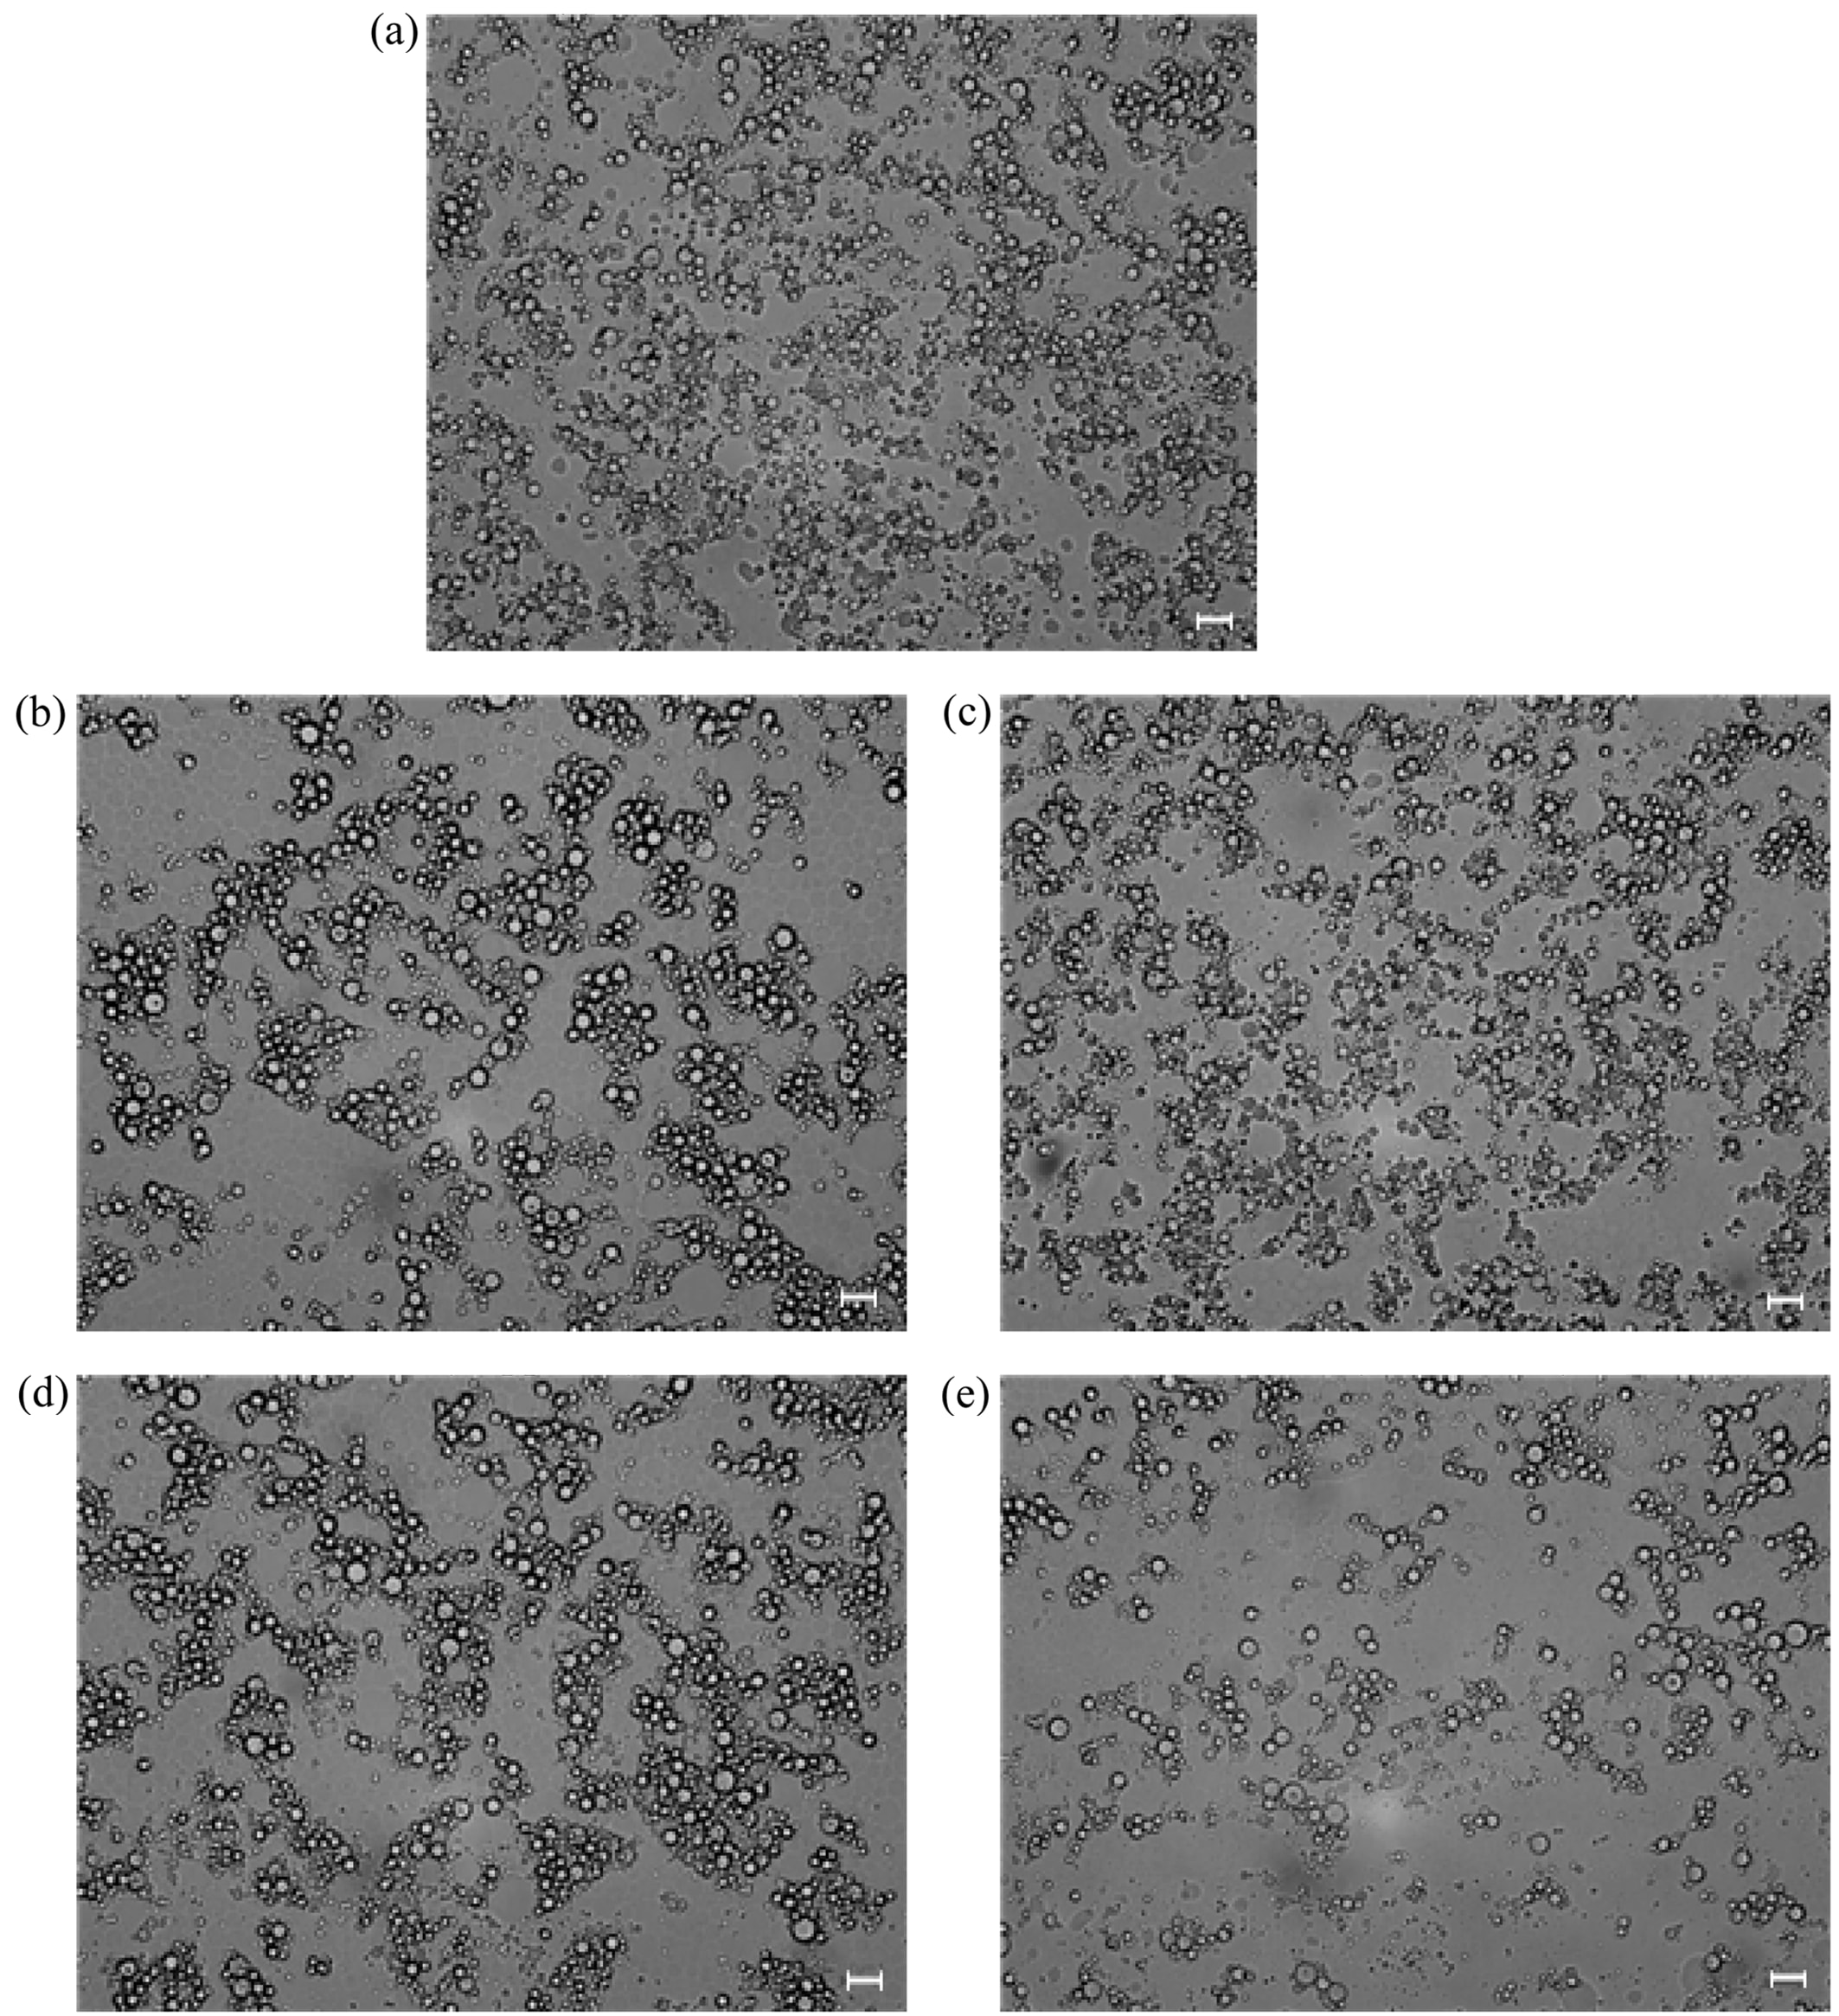
Next, changes in droplet size and distribution in the upper and bottom layers of ES-01 and ES-02 emulsions were observed immediately after preparation and after three and seven days of storage, using optical microscopy images as shown in Figure 5 and Figure 6. Immediately after preparation, both combinations exhibited relatively spherical droplets evenly dispersed, but from the third day of storage, the upper layers began to show aggregation of smaller droplets, and by the seventh day, these combined to form relatively larger droplets. In the bottom layers, due to the presence of a water-phase thickener, there was less aggregation compared to the upper layer, but after seven days, clusters of small droplets around large droplets were still observed, suggesting gradual interfacial destabilization was underway.
Optical microscopy showed that ES-02 had larger droplet sizes than ES-01, consistent with earlier particle size analysis. ES-01 initially exhibited a distribution of small and compact droplets, but rapid aggregation and coalescence occurred over time. This is interpreted as resulting from decreased interfacial stability in a mixed surfactant system with a large HLB value gap, where surfactant molecules are unevenly arranged at the interface. In contrast, ES-02 formed relatively large droplets initially, but maintained a fairly stable distribution during storage, owing to a small HLB value gap that allowed for more uniform molecular arrangement at the interface. In addition, the high glyceryl polymerization degree of PG10-S created a strong steric barrier, effectively suppressing droplet coalescence.
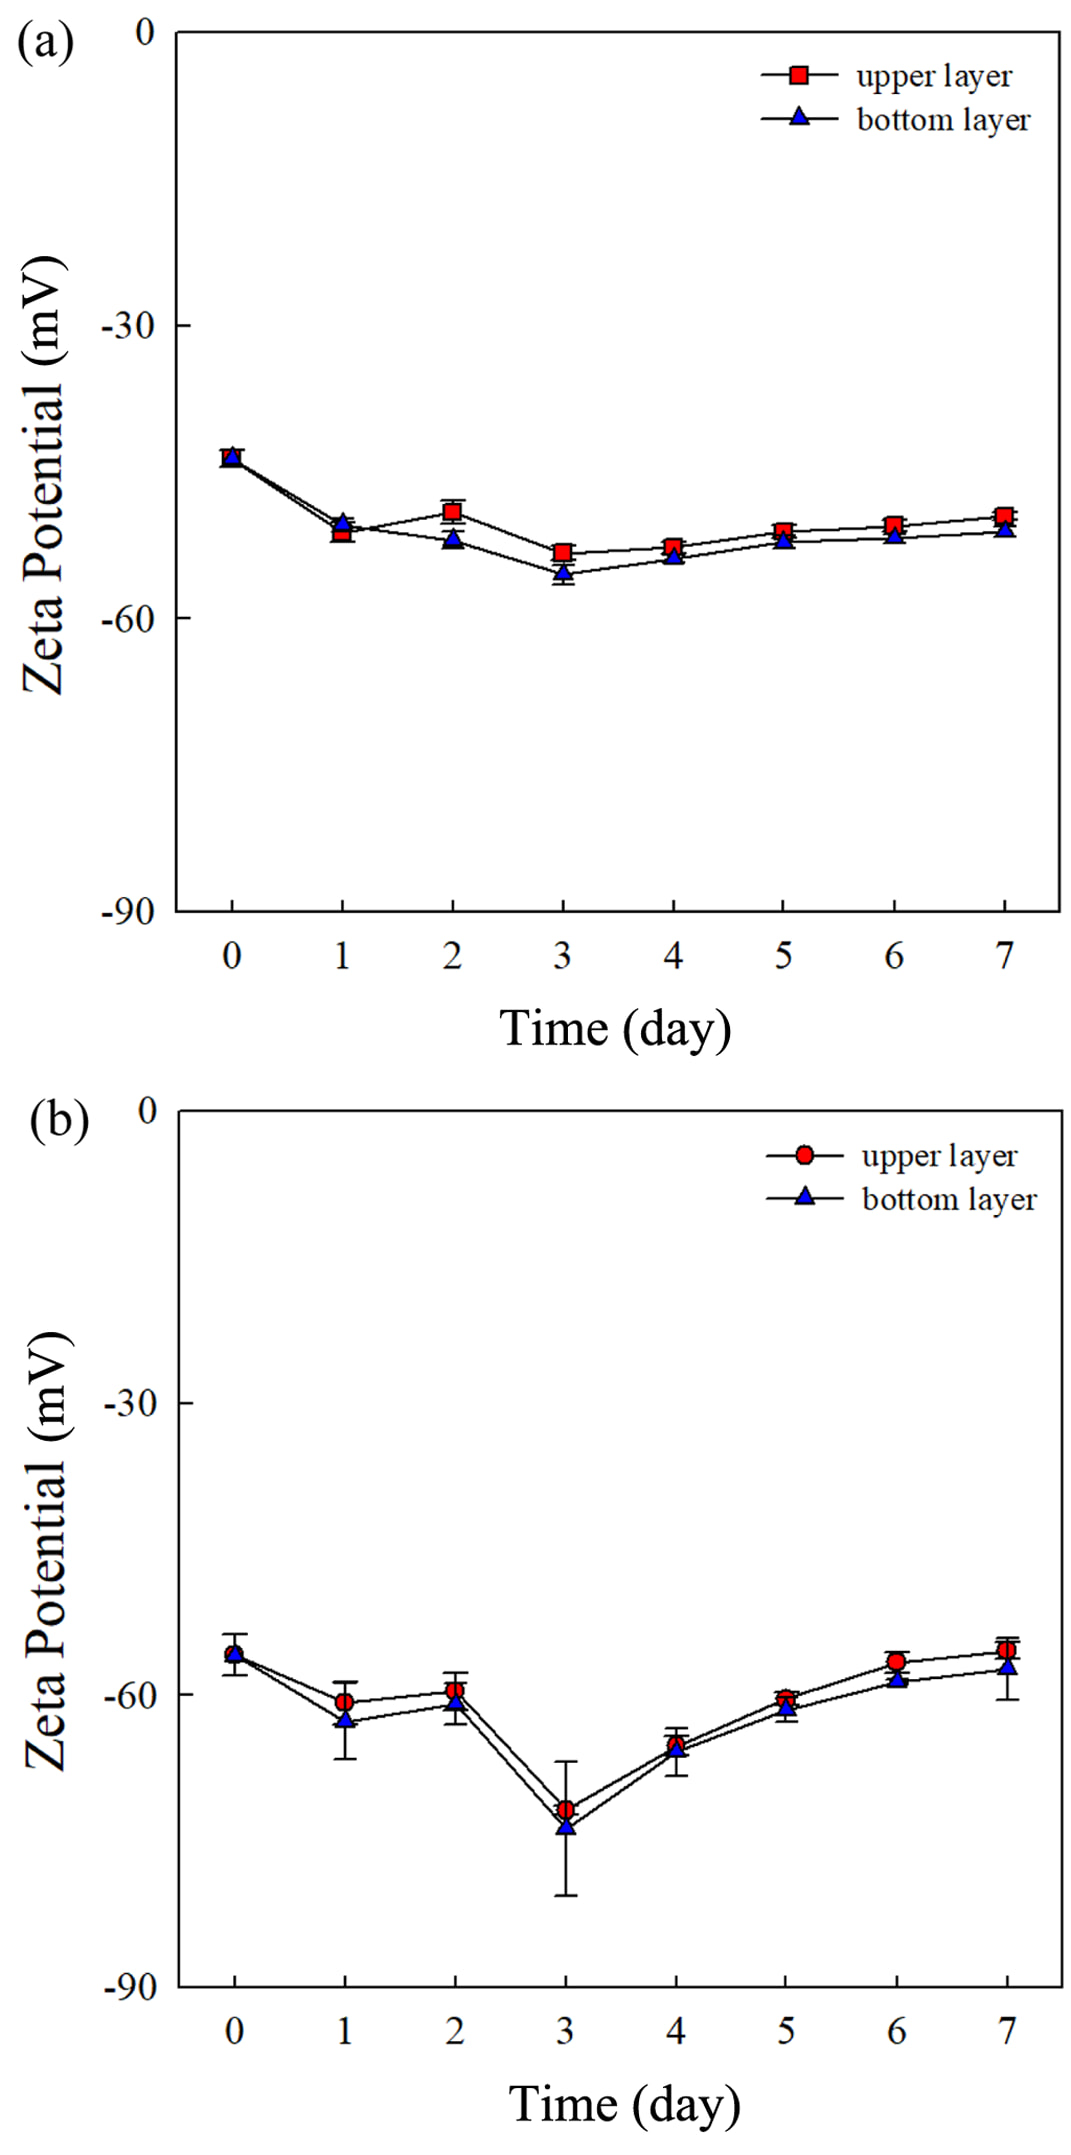
Figure 7 is a graph showing the changes in zeta potential of the upper and bottom layers according to the HLB value gap of the surfactant. For both ES-01 and ES-02, the absolute value of the zeta potential increases until the third day of storage, then decreases. This is believed to be the period during which the surfactant rearranges on the droplet surface and achieves stabilization.28 For ES-01, based on the absolute value, it started at –43.6 mV, increased to –53.3 mV on the third day, and then decreased to –49.5 mV. This is associated with the structural weakening of the interfacial membrane due to the uneven molecular arrangement at the interface, caused by the extreme hydrophilicity and hydrophobicity difference. ES-02 increased from –55.9 mV to –71.8 mV on the third day, and then decreased to –55.4 mV. After the third day, it was also confirmed that creaming was almost complete, so the amount of change was not significant. Since both the upper and bottom layers of ES-02 have a larger absolute value than ES-01, it can be interpreted that ES-02 has greater repulsive forces between droplets than ES-01, thus preventing aggregation and coalescence and resulting in superior physical stability. This is believed to be due to the formation of a dense and uniform molecular arrangement at the interface, creating a strong electric double layer.29 In both combinations, the bottom layer maintained a slightly higher absolute value than the upper layer, which can be interpreted as the result of using sodium polyacrylate as a thickener, which forms a large number of carboxylate groups in aqueous solution and exhibits strong negative charge, thus producing a higher zeta potential.30
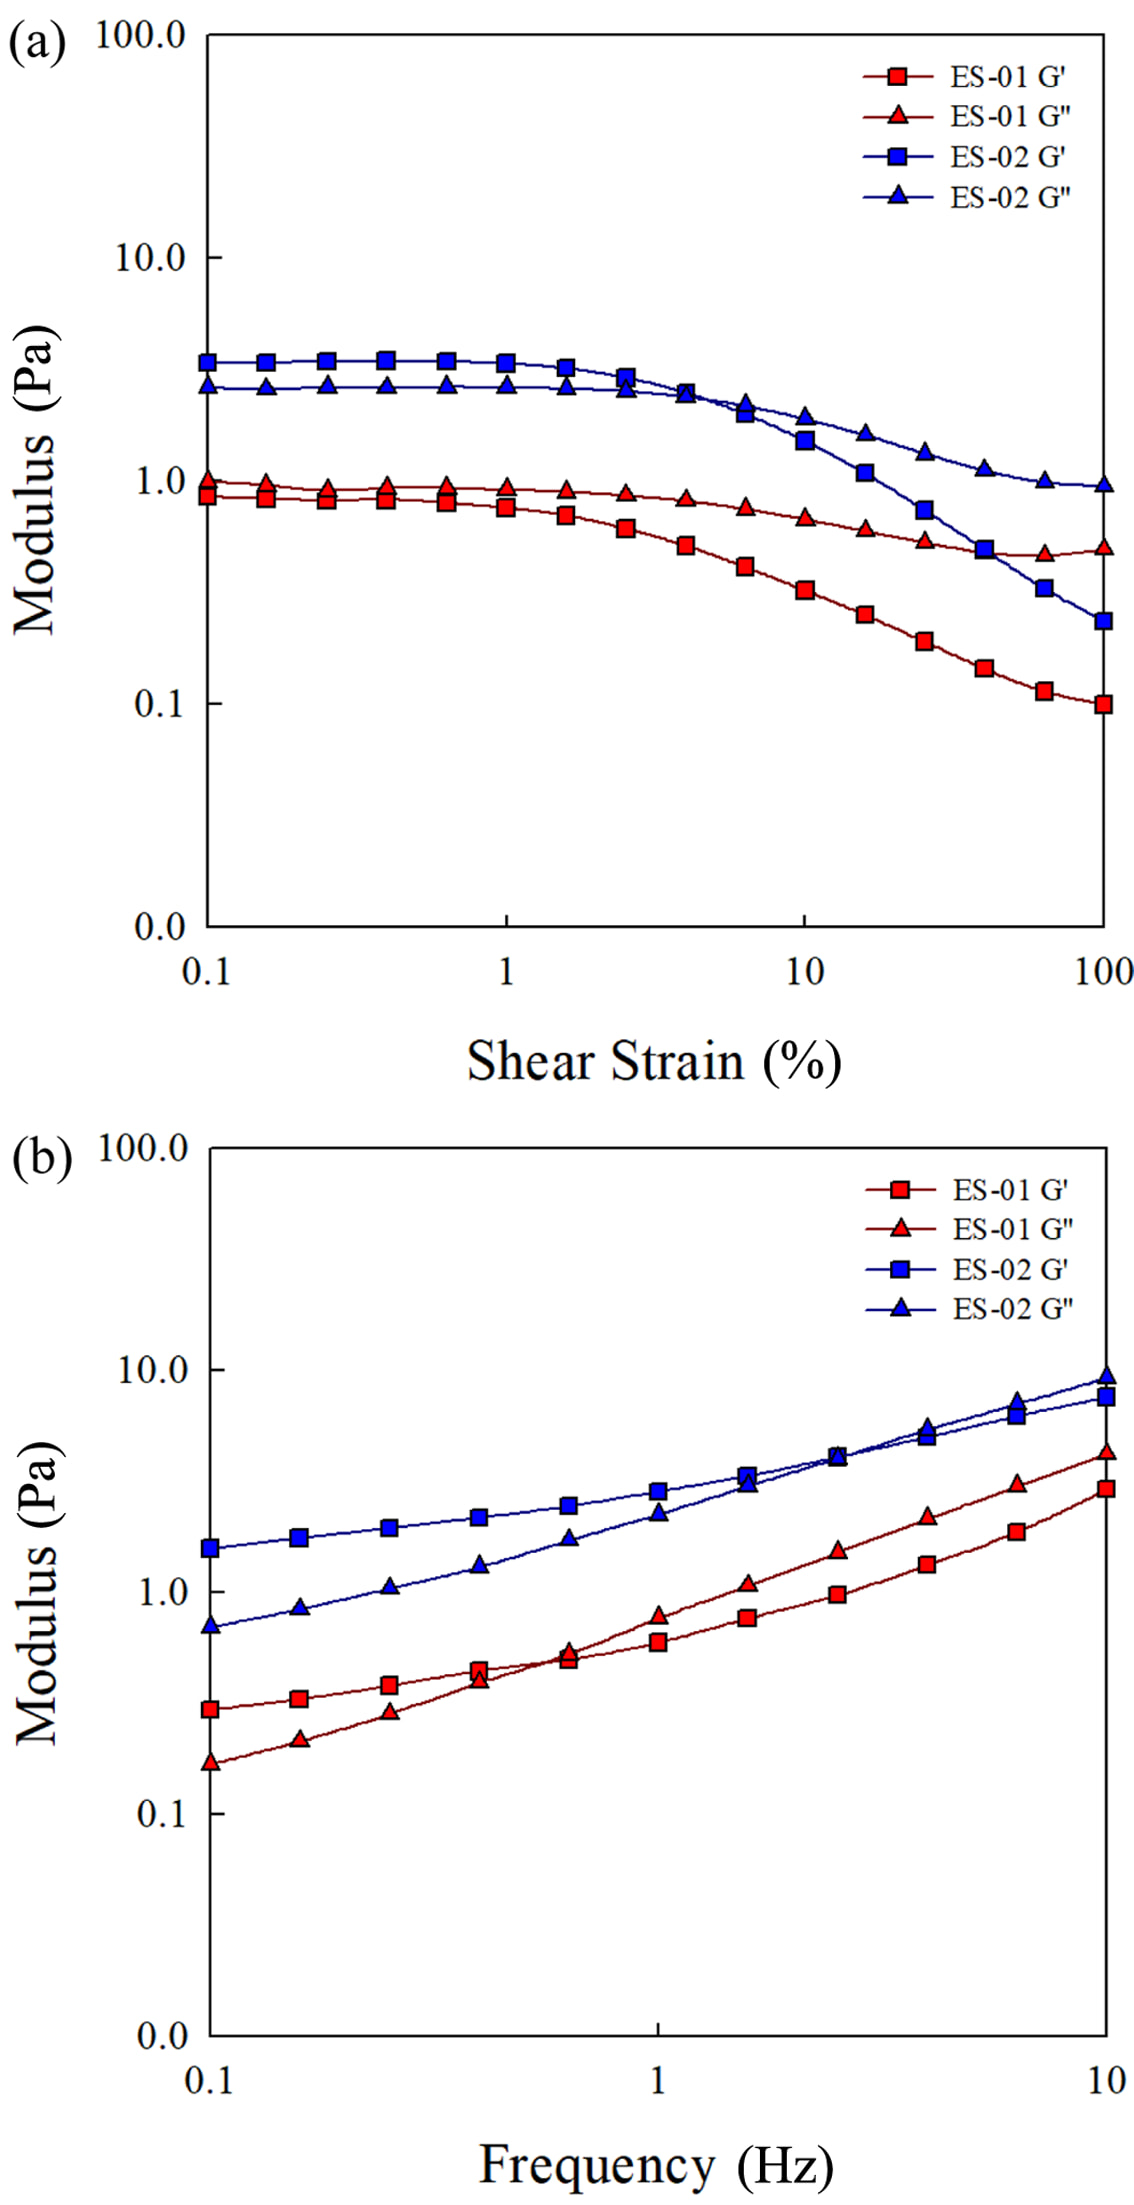
Figure 8 shows the rheometer measurement results of the upper phase separated layer of ES-01 and ES-02 after seven days of storage. Figure 8(a), the amplitude sweep, which shows the changes in storage modulus (G') and loss modulus (G'') as shear strain increases from 0.1% to 100% at a constant frequency of 1 rad/s. ES-01 had a shorter linear viscoelastic region compared to ES-02, and G'' was greater than G' in all regions. For ES-02, G' was greater than G'' at low shear strain, but as the shear strain increased, G'' became larger. Also, compared to ES-01, the absolute values of both G' and G'' were generally higher and the linear viscoelastic region was longer, indicating that it can withstand relatively higher shear strain. Figure 8(b), the frequency sweep, shows the values of G' and G'' when the shear strain is kept constant at 0.5% and the frequency is varied from 0.1 to 10 Hz. At first, both systems were gel-like since the storage modulus predominated, but as the frequency increased, loss modulus became dominant, showing more liquid-like behavior. For ES-01, the network between droplets easily broke down even at low frequency, which is why G'' was predominant. Similar to the amplitude sweep, ES-02 showed a higher absolute value for the modulus compared to ES-01, and the frequency at which G'' overtakes G' was also higher for ES-02. This suggests that the dense adsorption layer of surfactant molecules in ES-02 forms a strong steric barrier, providing excellent structural resilience to external stimuli.31
|
Figure 2 Contour graphs showing the effects of HLB value and sur- factant amount on (a) ESI; (b) MDS; (c) SPAN for ES-01. |
|
Figure 3 Contour graphs showing the effects of HLB value and sur-factant amount on (a) ESI; (b) MDS; (c) SPAN for ES-02. |
|
Figure 4 Time-dependent changes in (a) MDS of the upper layer; (b) SPAN of the upper layer; (c) MDS of the bottom layer; (d) SPAN of the bottom layer for emulsions prepared with different surfactant combinations. |
|
Figure 5 Optical microscopy images of ES-01 emulsions showing: (a) immediately after preparation; (b) upper layer after 3 days; (c) bottom layer after 3 days; (d) upper layer after 7 days; (e) bottom layer after 7 days (scale bar = 10 μm). |
|
Figure 6 Optical microscopy images of ES-02 emulsions showing: (a) immediately after preparation; (b) upper layer after 3 days; (c) bottom layer after 3 days; (d) upper layer after 7 days; (e) bottom layer after 7 days (scale bar = 10 μm). |
|
Figure 7 Zeta potential variations of the upper and bottom layers in (a) ES-01; (b) ES-02 emulsions over a 7 day storage period. |
|
Figure 8 Rheological properties of ES-01 and ES-02 emulsions after 7 days of storage: (a) amplitude sweep; (b) frequency sweep. |
|
Table 3 CCD-RSM Variance Analysis of Regression Coefficients for Various Response Values in Emulsification |
In this study, the impact of the HLB value gap of polyglyceryl (PG-based) mixed surfactants on the emulsification properties of MCT Oil-in-Water emulsions was evaluated. According to the CCD-RSM results, which set the mixed surfactant HLB value and surfactant amount as independent variables, for ES-01, the optimal conditions were a mixed surfactant HLB value of 10.37 and surfactant amount of 3.47 wt%, resulting in an ESI of 97.7%, MDS of 2.20 mm, and SPAN of 1.00. For ES-02, the optimal conditions were a mixed surfactant HLB value of 10.26 and surfactant amount of 3.59 wt%, yielding an ESI of 97.4%, MDS of 3.10 mm, and SPAN of 0.90. It was confirmed that the ES-02 combination, with a smaller HLB value gap, exhibited superior droplet distribution uniformity and droplet stability. Both combinations achieved a certain level of stability despite being thermodynamically unstable systems. However, ES-01, with a larger HLB value gap, formed relatively smaller MDS but had a larger SPAN, and aggregation and coalescence proceeded rapidly during storage. In contrast, ES-02, with a smaller HLB value gap, formed slightly larger MDS but demonstrated a smaller SPAN, maintaining high zeta potential and excellent viscoelastic properties over the storage period. These results show that the HLB value gap directly affects the uniformity of surfactant molecular arrangement, the structural strength of the interfacial film, and the electrostatic repulsion between droplets, playing a decisive role in the long-term stability of emulsions. This indicates that, in addition to the average HLB value of mixed surfactants, the HLB value gap also significantly influences interfacial structure and emulsification properties. Therefore, this study suggests that introducing the concept of the HLB value gap in the design of PG-based, PEG-free emulsion systems can serve as a foundational reference for developing more stable and uniform cosmetic formulations.
- 1. McClements, D. J.; Jafari, S. M. Improving Emulsion Formation, Stability and Performance Using Mixed Emulsifiers: A Review. Adv. Colloid Interface Sci. 2018, 251, 55-79.
-

- 2. Ahmad, A.; Ahsan, H. Lipid-based Formulations in Cosmeceuticals and Biopharmaceuticals. Biomed. Dermatol. 2020, 4, 12.
-
- 3. Rajput, Y.; Kulkarni, R. Unlocking the Potential: Cost-efficient and Sustainable Synthesis of Polyglycerol Ester Derivatives from Industrial By-products, Surface Properties Evaluation and Development of Moisturizing Creams. Ind. Crops Prod. 2023, 204, 117291.
-
- 4. Fiume, M.; Bergfeld, W.; Belsito, D.; Hill, R.; Klaassen, C.; Liebler, D.; Marks, J.; Shank, J.; Slaga, T.; Snyder, P.; Gill, L.; Heldreth, B. Safety Assessment of Polyglyceryl Fatty Acid Esters as Used in Cosmetics. Int. J. Toxicol. 2023, 42, 5S-101S.
-
- 5. Wang, F.; Yang, H.; Li, M.; Kang, X.; Zhang, X.; Zhang, H.; Zhao, H.; Kang, W.; Sarsenbekuly, B.; Aidarova, S.; Gabdullin, M. Study on Stabilization of Emulsion Formed by the Supramolecular System of Amphiphilic Polymer and Sodium Polyacrylic Acid. J. Mol. Liq. 2020, 314, 113644.
-
- 6. Kupongsak, S.; Sathivorapojjana, S. Properties and Storage Stability of O/W Emulsion Replaced with Medium-Chain Fatty Acid Oil. Pol. J. Food Nutr. Sci. 2017, 67, 107-115.
-
- 7. Matsaridou, I.; Barmpalexis, P.; Salis, A.; Nikolakakis, I. The Influence of Surfactant HLB and Oil/Surfactant Ratio on the Formation and Properties of Self-emulsifying Pellets and Microemulsion Reconstitution. AAPS PharmSciTech. 2012, 13, 1319-1330.
-
- 8. Wang, Q.; Zhang, H.; Han, Y.; Cui, Y.; Han, X. Study on the Relationships between the Oil HLB Value and Emulsion Stabilization. RSC Adv. 2023, 13, 24692-24698.
-
- 9. Pasquali, R.; Taurozzi, M.; Bregni, C. Some Considerations about the Hydrophilic-lipophilic Balance System. Int. J. Pharm. 2008, 356, 44-51.
-
- 10. Meybodi, N. M.; Mohammadifar, M. A.; Abdolmaleki, K. H. Effect of Dispersed Phase Volume Fraction on Physical Stability of Oil-in-Water Emulsion in the Presence of Gum Tragacanth. J. Food Qual. Hazards Control. 2014, 1, 102-107.
- 11. Thomas, C.; Allica, J.; Dunham, S.; McGrath, S.; Haefele, S. A Comparison of Soil Texture Measurements Using Mid-infrared Spectroscopy (MIPS) and Laser Diffraction Analysis (LDA) in Diverse Soils. Sci. Rep. 2021, 11, 16.
-
- 12. Lei, J.; Gao, Y.; Ma, Y.; Zhao, K.; Du, F. Improving the Emulsion Stability by Regulation of Dilational Rheology Properties. Colloids Surf. A Physicochem. Eng. Asp. 2019, 583, 123906.
-
- 13. Park, S. M.; Kim, J. M.; Lee, S. B. Emulsion Stability of PEG-free Oil-in-Water Emulsion Using Mixed Polyglyceryl Esters with Tailored Hydrophilic–lipophilic Balance (HLB) Value. Appl. Chem. Eng. 2025, 36, 461-466.
- 14. Chiarentin, L.; Cardoso, C.; Miranda, M.; Vitorino, C. Rheology of Complex Topical Formulations: An Analytical Quality by Design Approach to Method Optimization and Validation. Pharmaceutics 2023, 15, 1810.
-
- 15. Yin, Y.; Seo, D. S.; Lee, S. B. Extraction of the Skin-Whitening Ingredients from Hippophae Rhamnoides L. Fruits: Optimization Using Solubility Parameters. Appl. Chem. Eng. 2025, 36, 430-435.
- 16. Yeon, J. Y.; Shin, B. R.; Kim, T. G.; Seo, J. M.; Lee, C. H.; Lee, S. G.; Pyo, H. B. A Study on Emulsion Stability of O/W and W/S Emulsion according to HLB of Emulsifier. J. Soc. Cosmet. Sci. Korea 2014, 40, 227-236.
-
- 17. Park, Y. H.; Kim, H. J. Formulation and Stability of Horse Oil-in-water Emulsion by HLB System. Food Sci. Biotechnol. 2021, 30, 931-938.
-
- 18. Yan, G.; Wang, S.; Li, Y.; He, L.; Li, Y.; Zhang, L. Effect of Emulsifier HLB on Aerated Emulsions: Stability, Interfacial Behavior, and Aeration Properties. J. Food Eng. 2023, 351, 111505.
-
- 19. Nesterenko, A.; Drelich, A.; Lu, H.; Clausse, D.; Pezron, I. Influence of a Mixed Particle/Surfactant Emulsifier System on Water-in-Oil Emulsion Stability. Colloids Surf. A Physicochem. Eng. Asp. 2014, 457, 49-57.
-
- 20. Lindner, M.; Baumler, M.; Stabler, A. Inter-Correlation among the Hydrophilic-Lipophilic Balance, Surfactant System, Viscosity, Particle Size, and Stability of Candelilla Wax-Based Dispersions. Coatings. 2018, 8, 469.
-
- 21. Villalba, G. Effect of Dynamic Surfactant Adsorption on Emulsion Stability. Langmuir 2004, 20, 3872-3881.
-
- 22. Kong, Y.; Nikolov, A.; Wasan, D. Emulsion Stability in the Presence of Nonionic Surfactant Micelles: Role of Micellar Ordering and Ostwald Ripening. Ind. Eng. Chem. Res. 2010, 49, 5299-5303.
-
- 23. Baret, J.; Kleinschmidt, F.; Harrak, A.; Griffiths, A. Kinetic Aspects of Emulsion Stabilization by Surfactants: A Microfluidic Analysis. Langmuir 2009, 25, 6088-6093.
-
- 24. Tadros, T. F. Emulsion Formations and Stability; Wiley-VCH: Weinheim,2013.
-
- 25. Liu, H.; Tang, Y.; Zhang, S.; Xu, X.; Yang, J. Synthesis of Polyglycerol Fatty Acid Esters Catalyzed by Lipase and Evaluation of Its Emulsification Properties. LWT – Food Sci. Technol. 2023, 182, 114919.
-
- 26. Zhang, S.; Xu, X.; Yang, J.; Ren, J. Impact of Emulsifier Structure and Concentration on Lipolysis Dynamics and Curcumin Bioaccessibility in the Nanoemulsions Stabilized by Polyglycerol Fatty Acid Esters. Food Biophys. 2022, 17, 575-585.
-
- 27. Liang, X.; Wu, J.; Yang, X.; Tu, Z.; Wang, Y. Investigation of Oil-in-water Emulsion Stability with Relevant Interfacial Characteristics Simulated by Dissipative Particle Dynamics. Colloids Surf. A Physicochem. Eng. Asp. 2018, 546, 107-114.
-
- 28. Hong, S.; Park, B. R.; Lee, S. B. Preparation of Cosmeceuticals Containing Broussonetia kazinoki Extracts: Optimization Using Central Composite Design Method. Appl. Chem. Eng. 2018, 29, 682-689.
- 29. Kovacevic, A.; Savic, S.; Vuleta, G.; Muller, R. H.; Keck, C. M. Polyhydroxy Surfactants for the Formation of Lipid Nanoparticles (SLN and NLC): Effects on Size, Physical Stability and Particle Matrix Structure. Int. J. Pharm. 2011, 406, 163-172.
-
- 30. Ponzoni, C.; Cannio, M.; Rosa, R.; Leonelli, C. Stabilization of Bismuth Ferrite Suspensions in Aqueous Medium with Sodium Polyacrylate Characterized by Different Molecular Weights. Mater. Chem. Phys. 2015, 149-150, 246-253.
-
- 31. Hong, I. K.; Kim, S. I.; Lee, S. B. Effects of HLB value on Oil-in-water Emulsions: Droplet Size, Rheological Behavior, Zeta-Potential and Upper Index. J. Ind. Eng. Chem. 2018, 67, 123-131.
-
- Polymer(Korea) 폴리머
- Frequency : Bimonthly(odd)
ISSN 2234-8077(Online)
Abbr. Polym. Korea - 2025 Impact Factor : 1.0
- Indexed in SCIE
 This Article
-
2026; 50(5): 704-717
Published online Sep 25, 2026
- 10.7317/pk.2026.50.5.704
- Received on Apr 30, 2026
- Revised on Jun 25, 2026
- Accepted on Jul 8, 2026
Services
- Full Text PDF
- Abstract
- ToC
- Acknowledgements
- Conflict of Interest
Introduction
Experimental
Results and Discussion
Conclusion
- References
Shared
Correspondence to
- oung-Bong Choi
-
*Department of Chemistry, College of Science & Technology, Dankook University,
119 Dandae-ro, Dongnam-gu, Cheonan-si, Chungnam 31116, Korea
**Department of Cosmedical Materials, College of Bio-convergence, Dankook University, 119 Dandae-ro, Dongnam-gu, Cheonan-si, Chungnam 31116, Korea - E-mail: chem0404@dankook.ac.kr
- ORCID:
0000-0002-3862-456X
 Copyright(c) The Polymer Society of Korea. All right reserved.
Hyecheon Building(Room 601), #354, Gangnam-Daero, Gangnam-Gu, Seoul 06242, Korea
TEL : 82-2-568-3860, 561-5203, 569-3860 FAX : 82-2553-6938 E-mail: polymer@polymer.or.kr